In this new study, a little over 5,000 U.S. adults were shown a mix of five factual and five opinion statements across a range of policy and current event topic areas. For each, they were asked to identify the statement as either factual – one that could be proved or disproved based on objective factual evidence – or as an opinion.
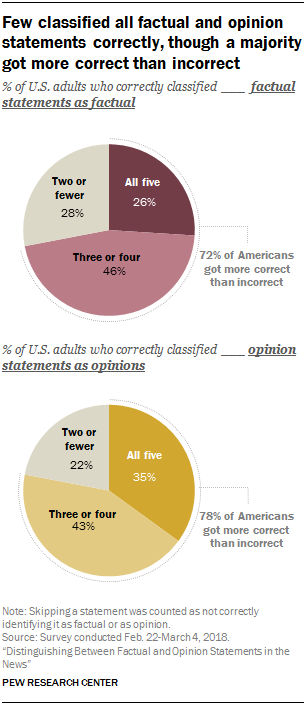
About a quarter of Americans (26%) correctly identified all five of the factual statements, while roughly the same percentage (28%) got no more than two correct. The largest portion (46%) answered three or four correctly. Overall, about three-quarters of Americans (72%) got more correct than incorrect – classifying at least three as factual.
A somewhat greater portion of Americans (35%) correctly identified all five of the opinion statements than did so with the factual statements. The largest portion again (43%) answered three or four correctly, while about two-in-ten (22%) misinterpreted most of the opinion statements as factual, classifying two or fewer as opinion. And, just like the factual statements, most Americans got more opinion statements correct than incorrect: About eight-in-ten (78%) correctly classified at least three of the five as opinions.
Some statements were correctly identified more often than others
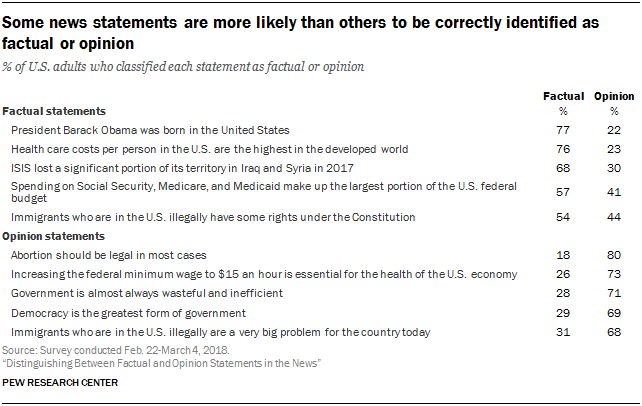
Overall, Americans were reasonably adept at identifying each of the five factual and five opinion statements. For each statement, a majority correctly identified it as either factual or opinion. However, Americans tended to better identify some statements than others. Among the factual statements, about three-quarters of Americans (77%) correctly identified “President Barack Obama was born in the United States” and about the same portion (76%) correctly classified “Health care costs per person in the U.S. are the highest in the developed world” as factual. The two factual statements that the public had the most difficulty with were “Spending on Social Security, Medicare, and Medicaid make up the largest portion of the U.S. federal budget” and “Immigrants who are in the U.S. illegally have some rights under the Constitution,” correctly labeled by just over half of respondents (57% and 54%, respectively).
Among the opinion statements, eight-in-ten Americans correctly identified “Abortion should be legal in most cases,” and around seven-in-ten correctly classified the other four opinion statements.
Most Americans classify statements that are not clearly factual or opinion as opinion
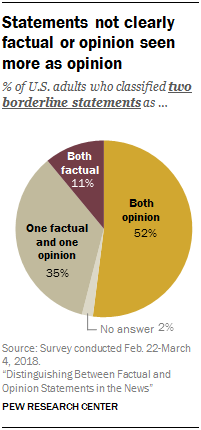
Not all news statements are unambiguously based in factual evidence or in a journalist’s or source’s beliefs, but rather fall somewhere in between the two. Statements that are in this murky space between factual statements and opinions – termed here as “borderline” statements – are more often treated by Americans as opinions.
In addition to the factual and opinion statements, respondents were asked to categorize two of these borderline statements. About half of Americans (52%) said both were opinions, compared with just 11% who said both were factual statements. About a third (35%) said one was factual and the other was opinion.
Looking at the individual statements, about three-quarters of Americans (74%) said “Applying additional scrutiny to Muslim Americans would not reduce terrorism in the U.S.” was an opinion, as did about two-thirds (66%) for “Voter fraud across the U.S. has undermined the results of our elections.”
While these two statements can be based in objective evidence (the factual element of the statement), the vague language – and in one case a prediction – makes these statements difficult to prove definitively (the opinion element of the statement). Thus, both of these were determined to be in this murky space between factual and opinion statements.
The statement “Applying additional scrutiny to Muslim Americans would not reduce terrorism in the U.S.” is predictive, and while evidence can be used to make an argument, it cannot be definitely proved or disproved because the results of such a policy in the U.S. are not yet known. For the second statement, “Voter fraud across the U.S. has undermined the results of our elections,” while there is a variety of evidence around the topic of voter fraud, the vagueness of the language of undermining election results makes it difficult to definitively show the relationship one way or the other.


