Overview
By almost every conceivable measure Americans are less positive and more critical of government these days. A new Pew Research Center survey finds a perfect storm of conditions associated with distrust of government – a dismal economy, an unhappy public, bitter partisan-based backlash, and epic discontent with Congress and elected officials.
Rather than an activist government to deal with the nation’s top problems, the public now wants government reformed and growing numbers want its power curtailed. With the exception of greater regulation of major financial institutions, there is less of an appetite for government solutions to the nation’s problems – including more government control over the economy – than there was when Barack Obama first took office.

The public’s hostility toward government seems likely to be an important election issue favoring the Republicans this fall. However, the Democrats can take some solace in the fact that neither party can be confident that they have the advantage among such a disillusioned electorate. Favorable ratings for both major parties, as well as for Congress, have reached record lows while o pposition to congressional incumbents, already approaching an all-time high, continues to climb.
The Tea Party movement, which has a small but fervent anti-government constituency, could be a wild card in this election. On one hand, its sympathizers are highly energized and inclined to vote Republican this fall. On the other, many Republicans and Republican-leaning independents say the Tea Party represents their point of view better than does the GOP.
These are the principal findings from a series of surveys that provide a detailed picture of the public’s opinions about government. The main survey, conducted March 11-21 among 2,505 adults, was informed by surveys in 1997 and 1998 that explored many of the same questions and issues. While a majority also distrusted the federal government in those surveys, criticism of government had declined from earlier in the decade. And the public’s desire for government services and activism was holding steady.
This is not the case today. Just 22% say they can trust the government in Washington almost always or most of the time, among the lowest measures in half a century. About the same percentage (19%) says they are “basically content” with the federal government, which is largely unchanged from 2006 and 2007, but lower than a decade ago.
Opinions about elected officials are particularly poor. In a follow-up survey in early April, just 25% expressed a favorable opinion of Congress, which was virtually unchanged from March (26%), prior to passage of the health care reform bill. This is the lowest favorable rating for Congress in a quarter century of Pew Research Center surveys. Over the last year, favorable opinions of Congress have declined by half – from 50% to 25%.

While job ratings for the Obama administration are mostly negative, they are much more positive than the ratings for Congress; 40% say the administration does an excellent or good job while just 17% say the same about Congress.
Federal agencies and institutions also are viewed much more positively than is Congress. Nonetheless, favorable ratings have fallen significantly since 1997-1998 for seven of 13 federal agencies included in the survey. The declines have been particularly large for the Department of Education, the FDA, the Social Security Administration, as well as the EPA, NASA and the CDC. In terms of job performance, majorities give positive ratings to just six of 15 agencies or institutions tested, including the military (80% good/excellent) and the Postal Service (70%).
As was the case in the 1997 study of attitudes about government, more people say the bigger problem with government is that it runs its programs inefficiently (50%) than that it has the wrong priorities (38%). But the percentage saying government has the wrong priorities has increased sharply since 1997 – from 29% to 38%.
Perhaps related to this trend, the survey also finds a rise in the percentage saying the federal government has a negative effect on their day-to-day lives. In October 1997, 50% said the federal government had a positive effect on their daily lives, compared with 31% who said its impact was negative. Currently, 38% see the federal government’s personal impact as positive while slightly more (43%) see it as negative.
Rising criticism about government’s personal impact is not limited to the federal government. Just 42% say their state government has a positive effect on their daily lives, down from 62% in October 1997. There is a similar pattern in opinions about the impact of local government – 51% now see the impact of their local government as positive, down from 64% in 1997.

Despite the attention captured by demonstrations and other expressions of anti-government sentiment, Americans’ feelings about the federal government run more toward frustration rather than anger. In the current survey, 56% say they are frustrated with the federal government, 21% say they are angry and 19% say they are basically content. Since October 1997, majorities have expressed frustration with the federal government, with a single notable exception; in November 2001, two months after the 9/11 attacks, just 34% said they were frustrated with the federal government.
And despite the frustration most Americans feel with government, a majority of the public (56%) says that if they had a child just getting out of school they would like to see him or her pursue a career in government; and 70% say the government is a good place to work, unchanged from October 1997.
However, along with the frustrated majority, which has remained fairly steady over the years, the survey also identifies a small but growing segment of the public that holds intense anti-government views. The proportion saying that they are angry with the federal government has doubled since 2000 and matches the high reached in October 2006 (20%).
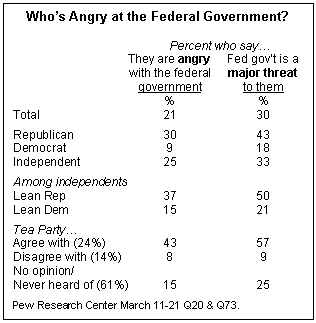
Over this period, a larger minority of the public also has come to view the federal government as a major threat to their personal freedom – 30% feel this way, up from 18% in a 2003 ABC News/Washington Post survey. Intense anti-government sentiment is highly concentrated among certain groups – Republicans, independents and others who lean Republican, and those who agree with the Tea Party movement.
For example, 43% of Republicans say the federal government presents a major threat to their personal freedom, as do 50% of independents who lean Republican and fully 57% of those who agree with the Tea Party movement. That compares with just 18% of Democrats, 21% of independents who lean Democratic and just 9% of those who disagree with the Tea Party movement.
The Perfect Storm
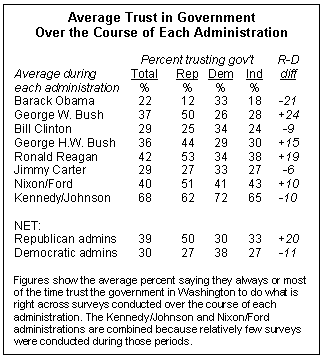
The current survey and previous research have found that there is no single factor that drives general public distrust in government. Instead, there are several factors – and all are currently present. First, there is considerable evidence that distrust of government is strongly connected to how people feel about the overall state of the nation.1 Distrust of government soars when the public is unhappy with the way things are going in the country.
The recent downward trend in trust in government began in the fall of 2008, when public satisfaction plunged amid the financial crisis. In early October 2008, 11% said they were satisfied with the way things were going in this country – the lowest measure in more than two decades of Pew Research Center polling. That same month, a CBS/New York Times survey found just 17% saying they could trust the government in Washington to do what is right, which matched an all-time low seen previously only in the summer of 1994.
A second element is presidential politics. Trust in government is typically higher among members of the party that controls the White House than among members of the “out” party. However, Republicans’ views of government change more dramatically, depending on which party holds power, than do Democrats’. Republicans are more trusting of government when the GOP holds power than Democrats are when the Democrats are in charge.
This pattern is particularly evident in the Obama era. The president’s policies – especially the year-long effort to overhaul the health care system – have served as a lightning rod for Republicans. Currently, just 13% of Republicans say they can trust the government in Washington to do what is right, nearly equaling a low point reached in June 1994 during the Clinton administration (11%).
A third factor is that a particular subgroup of independents, who are financially pressed, chronically distrustful of government and who typically lean to the Republican Party, appears to be especially angry today. Pew political typology surveys in the past have labeled these individuals as “disaffecteds.” This group may explain, in part, why at least as many Republican-leaning independents (37%) as conservative Republicans (32%) say they are angry with the government. And identical percentages of Republican-leaning independents and conservative Republicans (53% each) say they agree with the Tea Party movement.

Finally, record discontent with Congress – and dim views of elected officials generally – have poisoned the well for trust in the federal government. Undoubtedly, this has contributed to growing discontent with government even among groups who are generally more positive about it, such as Democrats. Today, many fewer Democrats say they trust government than did so during the later Clinton years. And just 40% of Democrats have a favorable impression of the Democratic Congress – the lowest positive rating for Congress ever among members of the majority party.
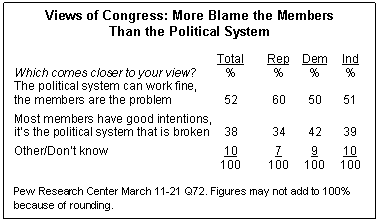
For the most part, the public sees the members of Congress themselves, rather than a broken political system, as the problem with the institution. A majority says (52%) that the political system can work fine, it’s the members of Congress that are the problem; 38% say that most members of Congress have good intentions, but the political system is broken.
Public opinion about elected officials in Washington is relentlessly negative. Favorable ratings for the Democratic Party have fallen by 21 points – from 59% to 38% – over the past year and now stand at their lowest point in Pew Research surveys. The Republican Party’s ratings, which increased from 40% last August to 46% in February, have fallen back to 37%.
When asked about a series of criticisms of elected officials in Washington – that they care only about their careers, are influenced by special interests, are unwilling to compromise, and are profligate and out-of-touch – large majorities (no fewer than 76%) agree with each of the statements. And while 56% say they would like their child to pursue a career in government, far fewer (36%) say the same about their child making a career in politics.
It’s Not Just Government

While anti-government sentiment has its own ideological and partisan basis, the public also expresses discontent with many of the country’s other major institutions. Just 25% say the federal government has a positive effect on the way things are going in the country and about as many (24%) say the same about Congress. Yet the ratings are just as low for the impact of large corporations (25% positive) and banks and other financial institutions (22%). And the marks are only slightly more positive for the national news media (31%) labor unions (32%) and the entertainment industry (33%).
Notably, those who say they are frustrated or angry with the federal government are highly critical of a number of other institutions as well. For example, fewer than one-in-five of those who say they are frustrated (18%) or angry (16%) with the federal government say that banks and other financial institutions have a positive effect on the way things are going in the country.
Familiar Complaints, Growing Concerns
As in the past, poor performance is the most persistent criticism of the federal government. Fully 74% think that the federal government does only a fair or poor job of running its programs, which is on par with opinions in the late 1990s.
But another strain of criticism is that the federal government’s priorities are misguided and that government policies do too little for average Americans. More than six-in-ten (62%) say it is a major problem that government policies unfairly benefit some groups while nearly as many (56%) say that government does not do enough to help average Americans.
Since 1997, there has been a substantial increase in the percentage saying that middle-class people get less attention from the federal government than they should; 66% say that currently, up from 54% thirteen years ago. In contrast with many opinions about government, this view is shared by comparable percentages of Republicans (68%), Democrats (67%) and independents (65%). Conversely, about half of Republicans (52%), Democrats (52%) and independents (47%) say that Wall Street gets more attention than it should from the federal government.

The size and power of the federal government also engender considerable concern. A 52% say it is a major problem that the government is too big and powerful, while 58% say that the federal government is interfering too much in state and local matters.
The public is now evenly divided over whether federal government programs should be maintained to deal with important problems (50%) or cut back greatly to reduce the power of government (47%). In 1997, a clear majority (57%) said government programs should be maintained. Greater support for cutting back government programs is seen among Republicans (up 14 points) and independents (eight points); by contrast, just 27% of Democrats say programs should be greatly cut back, unchanged from 1997.
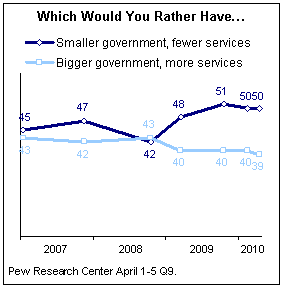
A desire for smaller government is particularly evident since Barack Obama took office. In four surveys over the past year, about half have consistently said they would rather have a smaller government with fewer services, while about 40% have consistently preferred a bigger government providing more services. In October 2008, shortly before the presidential election the public was evenly divided on this issue (42% smaller government, 43% bigger government).
The Regulation Paradox
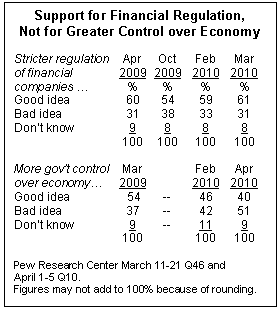
Despite the public’s negative attitudes toward large corporations, most Americans (58%) say that “the government has gone too far in regulating business and interfering with the free enterprise system.” This is about the same percentage that agreed with this statement in October 1997 (56%).
Along these lines, the public opposes government exerting more control over the economy than it has in recent years. Just 40% say this is a good idea, while 51% say it is not. Last March, the balance of opinion was just the opposite. By 54% to 37%, more people said it was a good idea for the government to exert greater control over the economy.
While the public is wary of too much government involvement with the economy, it suspends that concern when it comes to stricter regulation of major financial companies. A clear majority (61%) says it is a good idea for the government to more strictly regulate the way major financial companies do business, which is virtually unchanged from last April (60%).
Government Distrust and Midterm Politics
Hostility toward government seems likely to be a significant election issue and an important element in both midterm voting intentions and turnout. While there was widespread distrust of the federal government in the late 1990s, just 37% went so far as to say that the federal government needed “very major reform.” Today, that figure stands at 53%; increasing numbers of Republicans, independents and Democrats say that government needs very major reform. Still, far more Republicans (65%) and independents (54%) than Democrats (41%) express this view.
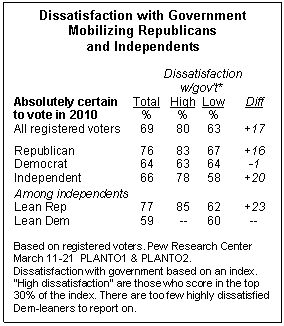
Consistent with this pattern of partisanship, anti-government sentiment appears to be a more significant driver of possible turnout among Republicans and independents than among Democrats. Among Republican voters who are highly dissatisfied with government, 83% say they are absolutely certain to vote in the midterm elections; that compares with 67% of Republicans who express low levels of frustration with government. By contrast, there is no difference in intention to vote among Democrats who are highly frustrated with government (63%) and those who are less frustrated (64%).

Perhaps more troubling for Democrats, the link between dissatisfaction with government and voting intentions is at least as strong among independent voters. Independents who are highly dissatisfied with government are far more committed to voting this year than are independents who are less frustrated (78% vs. 58%). Overall, independents voters slightly favor the GOP candidate in their district by a 41% to 34% margin, but those who are highly dissatisfied with government favor the Republican candidate by an overwhelming 66% to 13% margin. Independents who are less dissatisfied with government favor the Democratic candidate in their district (by 49% to 24%), but are much less likely to say they are certain to vote.
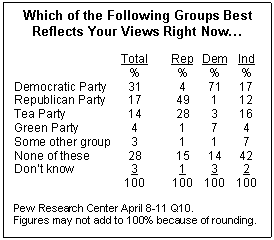
While the GOP has a decided enthusiasm advantage predicated on discontent with government, it has a potential unity problem given the appeal of the Tea Party to many of its members. Only about half of Republicans (49%) say that the GOP is the party that best reflects their views right now, while as many as 28% cite the Tea Party. Among independents who lean Republican, the problem is potentially greater: As many say the Tea Party best reflects their views right now (30%) as the GOP (29%), with nearly as many saying nobody is representing their views (28%).

About the Surveys
This extensive study of public attitudes toward the federal government serves as an update and expansion of the Pew Research Center’s 1998 Deconstructing Distrust report (https://www.pewresearch.org/politics/report/95/how-americans-view-government). Results are based on interviews from four telephone surveys conducted on landline and cell phones of nationwide samples of adults living in the continental United States.
The main survey was conducted March 11-21, 2010 with a sample of 2,505 adults. Interviews were conducted in English and Spanish. For the total sample of 2,505 interviews, the margin of sampling error that would be expected at the 95% confidence interval is plus or minus 2.5 percentage points. The margin of error for subgroups is larger.
Three other surveys of approximately 1,000 adults each were conducted March 18-21, April 1-5 and April 8-11. Interviews were conducted in English. The margin of sampling error for these surveys is plus or minus 4 percentage points.