The findings in this report are based on the analysis of two main sources of data: 1) a content analysis of the news coverage of the first 60 days of the Biden administration, and 2) a nationally representative survey of U.S. adults conducted between March 8 to March 14, 2021. Below are the details of both of the data sources for this study.
Content analysis of first 60 days of the Biden administration
Media coverage of President Joe Biden and his administration is based on data collected from Jan. 21 to March 21, 2021. This time frame begins the day following the inauguration of Biden and includes all weekdays through his 60th day in office (not including inauguration day). The study is not an analysis of media bias or evaluating whether the coverage of Biden and his administration was accurate or fair.
The content analysis part of the study was conducted in multiple parts: a main analysis, and a secondary long-term trend analysis. The main analysis studied stories about the president and his administration from a set of digital and broadcast news media (the main sample). In order to compare across administrations going back to the Clinton administration in 1993, the analysis pulled stories from a limited set of outlets (the long-term trend sample).
Sample design
Main sample
The main sample incorporated news stories from a selection of broadcast outlets, digital news sites and the digital presence of broadcast outlets and print newspapers. The selection criteria for each platform are described below, along with the sampling method for qualifying stories from each outlet.
For this project, qualifying stories were defined as stories that were at least 50% about Biden and/or his administration.
Broadcast
Outlet selection
News content was collected and studied from the television broadcasts of four cable news networks (CNN, FOX, MSNBC, Newsmax), four major broadcast networks (ABC, CBS, NBC, PBS), and radio broadcasts of NPR and the two highest rated talk radio shows focused on political affairs and current events, according to Talkers.com (The Sean Hannity Show and The Mark Levin Show).1 In all cases, the first 30 minutes of selected programs (defined below), Monday through Friday, were screened for qualifying segments.
Cable
Cable news programming draws its largest audience in prime time. Researchers studied the news programs on each cable network between 7 p.m. and 11 p.m. for MSNBC and Fox News and between 5 p.m. and 11 p.m. for CNN.2 Shows from CNN, Fox News and MSNBC were randomly selected such that two shows from each cable network were included in the sample on each weekday. In all cases, the first 30 minutes of selected programs, Monday through Friday were screened for qualifying stories.
Newsmax is a new addition to this group of cable news outlets this year. Sometimes viewed as a potential competitor to Fox News, about one-in-ten U.S. adults report getting news from the outlet. Researchers studied the first 30 minutes of one selected program from Monday through Thursday between 7 p.m. and 11 p.m.
Network nightly news
Researchers studied weekday evening news programming from ABC, CBS, NBC and PBS’s NewsHour. Two outlets were randomly selected each day and the first 30 minutes of selected programs (all shows ran for 30 minutes except for PBS NewsHour) were screened for qualifying segments.
Radio
Every episode of The Mark Levin Show and The Sean Hannity Show (radio) was included in the sample. For NPR, episodes from Morning Edition and All Things Considered were randomly selected such that one was included each day. Researchers studied the first 30 minutes of each selected program for qualifying segments.
Radio broadcasts were recorded from online streams using automated tools or were accessed through their website. In cases where shows were accidentally not recorded, or the streams were preempted for other programming (although the show itself was still produced), researchers used alternate recordings such as official podcasts.
Story selection
For each outlet selected each day, human coders separated the shows based on segments and determined whether each segment should be included in the sample using a set of rules regarding relevance to the administration. Consequently, only segments from the first 30 minutes of a program that focused primarily (at least 50%) on Biden or the administration’s actions and policies were analyzed. Segments that were shorter than 60 seconds were not included in this study.
Outlets and shows included in the broadcast component of the main sample:
Network ABC World News Tonight with David Muir CBS Evening News with Norah O’Donnell NBC Nightly News with Lester Holt PBS NewsHour
Cable CNN
- The Situation Room with Wolf Blitzer (5 p.m.)
- Erin Burnett OutFront (7 p.m.)
- Anderson Cooper 360 (8 p.m.)
- Cuomo Prime Time (9 p.m.)
- CNN Tonight with Don Lemon (10 p.m.)
Fox News
- Fox News Primetime (7 p.m.)3
- Tucker Carlson Tonight (8 p.m.)
- Hannity (9 p.m.)
- The Ingraham Angle (10 p.m.)
MSNBC
- The ReidOut (7 p.m.)
- All In With Chris Hayes (8 p.m.)
- The Rachel Maddow Show (9 p.m.)
- The Last Word With Lawrence O’Donnell (10 p.m.)
Newsmax
- Greg Kelly Reports (7 p.m.)
- Stinchfield (8 p.m.)
- Spicer & Co. (9 p.m.)
- Rob Schmitt Tonight (10 p.m.)
Radio All Things Considered (NPR) Morning Edition (NPR) The Mark Levin Show The Sean Hannity Show
Digital content
Outlet selection
Digital outlets Digital outlets were selected using Comscore Media Metrix® data to determine the average monthly audience of outlets. Unique visitors from October 2020 through December 2020, which were acquired from the Comscore Media Metrix® database for Total Digital Population, were used to determine a site’s inclusion in the study. To be included, a site needed to receive at least 30 million average unique monthly visitors in October-December 2020. This led to a list that included several technology, sports and culture sites that did not extensively report on national affairs or political issues. Researchers then filtered this list to only include sites that produce original content and cover political issues. Sites that mainly focus on either regional or international news were excluded. One business-focused outlet with political content and higher web traffic in the time period analyzed than any other similar outlets (Business Insider) was included.
Additionally, to broaden the list of outlets included in this study, two additional outlets were included, Breitbart and Washington Examiner. While these two outlets did not receive at least 30 million average unique monthly visitors in October-December 2020, these outlets were included based on a combination of factors, such as their presence on social media (according to data from CrowdTangle) and relatively high online sharing and engagement during the early parts of the 2020 presidential election and COVID-19 pandemic.
The digital sites included were:
- Breitbart
- Business Insider (now a part of Insider)
- BuzzFeed
- HuffPost
- New York Post
- Newsweek
- Politico
- The Hill
- Vox
- Washington Examiner
Digital content of print newspapers Four print newspapers that focused on national affairs in their daily coverage were selected for study, based on their circulation ranking (according to the Alliance for Audited Media). Researchers also verified that the websites of these four legacy newspapers had traffic of at least 30 million average monthly unique visitors in October through December 2020 using Comscore data.
The included newspapers were:
- The New York Times
- USA Today
- The Wall Street Journal
- The Washington Post
Digital content of broadcast outlets Researchers verified that the digital presence for the broadcast outlets identified above had traffic of at least 30 million average monthly unique visitors in October through December 2020 using Comscore data. The digital presence of most broadcast outlets met these criteria, with the websites of MSNBC, Newsmax, PBS, The Mark Levin Show and The Sean Hannity Show (radio) being the exceptions. Digital content for these outlets was not included.
Story selection
The number of stories selected from each outlet was determined by Comscore traffic. Two stories per weekday were selected from outlets whose websites received more than 50 million average monthly unique visitors from October through December 2020, and one story per weekday was selected from sites below 50 million average monthly unique visitors during this time period (the number of stories per weekday for each outlet is noted below).
The outlets from which two digital stories were coded were: ABC News, Business Insider, CBS News, CNN, Fox News, NBC News, NPR, New York Post, Politico, The Hill, The New York Times, The Washington Post, USA Today and The Wall Street Journal. The outlets from which one digital story was coded were: Breitbart, BuzzFeed, HuffPost, Newsweek, Vox and Washington Examiner.
Each day’s homepage was used to select stories; homepages were drawn from snapshots that were taken at 9 a.m., 2 p.m., and 9 p.m. (all times Eastern) each day, and the snapshots used were randomly selected from among those times (e.g., one day may use 9 a.m. and the next 2 p.m.). These snapshots were collected using automated methods; across all sites, researchers wrote scripts to record the HTML and screenshot of the front page of each site at each of the times above.
The most prominent stories (in terms of where they appear on the home page) that focused on the Biden administration (at least 50% about Biden or his administration) were selected for analysis. Stories that were shorter than 100 words were not included in this study. If there were no relevant stories from the randomly selected snapshot, other snapshots from that day were substituted.
The main sample had a total of 1,812 stories.
Long-term trend sample
The long-term trend sample duplicates for 2021 the samples used in other Pew Research Center studies conducted on the beginning of the presidencies of Bill Clinton, George W. Bush, Barack Obama and Donald Trump. This sample consisted of seven media outlets – two newspapers, one news magazine and four broadcasts – in order to replicate these previous studies. The 2021 time period was Jan. 21 to March 21, 2021. This covers the first 60 days of Biden’s presidency, excluding Inauguration Day, in line with these previous studies.
The specific outlets, selected to develop a sample of coverage provided by the national press, are:
Newspapers The New York Times The Washington Post
Weekly magazine Newsweek
Evening network TV ABC World News Tonight with David Muir CBS Evening News with Norah O’Donnell NBC Nightly News with Lester Holt PBS NewsHour
Newspaper stories were drawn from the digital replica of section front pages (i.e., national news, style, business, metro, Sunday review) of the print edition of each outlet. Stories that were shorter than 100 words were not included in this study. In prior years, all such stories, as well as the complete newscasts and complete issues of Newsweek, were the basis for the sample of television and magazine stories. In this study, a random sample drawn from all available stories that met these criteria was included. The resulting sample had 247 stories. The 2017 sample had 326 stories, the 2009 sample had 362 stories, the 2001 sample had 333 stories and the 1993 sample had 566 stories.
Human coding of stories
The data in this study was created by a team of nine coders who were trained specifically for this project.
The central variables in this study were:
- Topic refers to the general subject matter of the story. For every story, each paragraph was assigned a topic, and the overall topic assigned to the story was the one that was the most common. There were a total of 47 different topics, which are grouped below into the three broad topic categories used throughout the analysis – domestic issues, foreign affairs issues and personal/political issues:
- Domestic issues – Abortion/family planning, agriculture, budget/taxes, business/economy, campaign finance, crime incident or trends, crime/gun policy, culture/arts, defense (U.S. domestic), disasters, education, election process, environment, health care, immigration, labor, poverty, religion, science/technology, women’s rights, Social Security, energy, news media, racial justice, LGBTQ+, other civil liberties/civil rights broadly, social media, made-up information/conspiracy – QAnon specifically, other made-up information/conspiracy, refusal to accept Biden administration, other domestic issues
- Foreign affairs – Foreign trade, Iraq/Afghanistan generally, Iran, China, Russia, North Korea, European Union/NATO, United Kingdom, Israel/Palestine, international terrorism, other foreign issues
- President’s management and political approach – Personal profile/character, appointments/nominations, political skills, political philosophy/ideology
- Other
- Frame refers to what the journalist is evaluating the president and his administration on. This study classified stories into one of two main frames: 1) leadership and character or 2) core ideology and policy agenda. For every story, each paragraph was assigned a frame, and the overall frame assigned to the story was the one that accounted for a majority of the paragraphs.
- Source type refers to a person, group, organization or publication cited in a story. Citations included direct or indirect quotes, interviews, attributions or references accompanying factual information. With this in mind, researchers coded for the presence of 13 different source types. Within each story, a source type was coded only once, even if it was cited repeatedly. The 13 source types were:
- Biden or a member of the administration
- A member of the Biden family (including Jill Biden)
- Congressional Democrat
- Congressional Republican
- State or local officials
- Foreign officials
- Donald Trump & Trump family/former administration (including Melania Trump, Donald Trump Jr., Ivanka Trump, Jared Kushner, Eric Trump, Mike Pence, Mike Pompeo, Bill Barr, Rudy Giuliani, Michael Flynn)
- Issue-based groups and experts
- Businesses/corporations
- Polls
- Other journalist or news organization
- Citizen
- Anonymous/unnamed sources
- Assessment of the Biden administration refers to a story’s overall tone toward the president and the administration’s actions or words. The evaluation measure is tied to the frame of the story – either leadership and character or core ideology and policy agenda. Each statement (made by a source or the reporter him or herself) in a story was analyzed to determine whether it carried a positive, negative or neither positive nor negative assessment of the president and his administration. Within a story, there needed to be at least twice as many positive as negative statements for a story to be considered positive, and vice versa to be considered negative. Otherwise stories were coded as neither positive nor negative.
- COVID-19 focus refers to the extent to which COVID-19 was mentioned as part of the story. This captures whether COVID-19 was a major part of the story (focused on in at least 50% of the story), a minor part of the story (at least one mention, but not focused on in at least 50% of the story), or not a part of the story.
- Trump mention: Each story was analyzed for whether former President Donald Trump was mentioned. This includes all mentions of him, but not of other individuals such as his family members and former administration members or of references to his administration broadly.
Coders were given multiple sets of news stories from each platform type to evaluate during the training period. Once internal agreement on how to code the variables was established, coding of the content for the study began. The Krippendorf Alpha estimate for each variable is below. For each variable, this estimate is based on a minimum of 103 stories and upwards of 133 stories.
- Topic: 0.80
- Frame: 0.64
- Source type: Minimum of 0.73 (average of 0.83)
- Assessment of the Biden administration: 0.72
- COVID-19 focus: 0.92
Throughout the coding process, staff discussed questions as they arose and arrived at decisions under supervision of the content analysis team leader. In addition, the team leader checked coders’ accuracy throughout the process.
The American Trends Panel survey methodology
Overview
The American Trends Panel (ATP), created by Pew Research Center, is a nationally representative panel of randomly selected U.S. adults. Panelists participate via self-administered web surveys. Panelists who do not have internet access at home are provided with a tablet and wireless internet connection. Interviews are conducted in both English and Spanish. The panel is being managed by Ipsos.
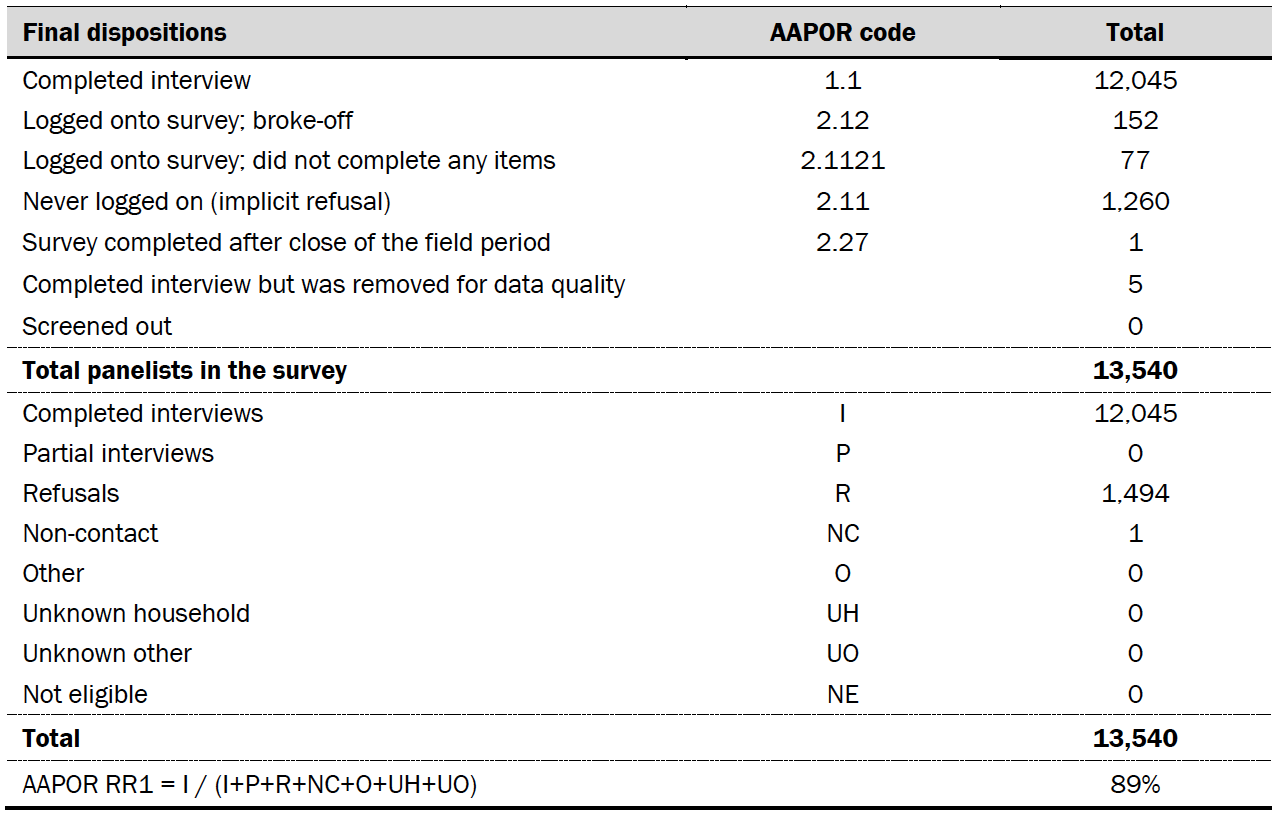
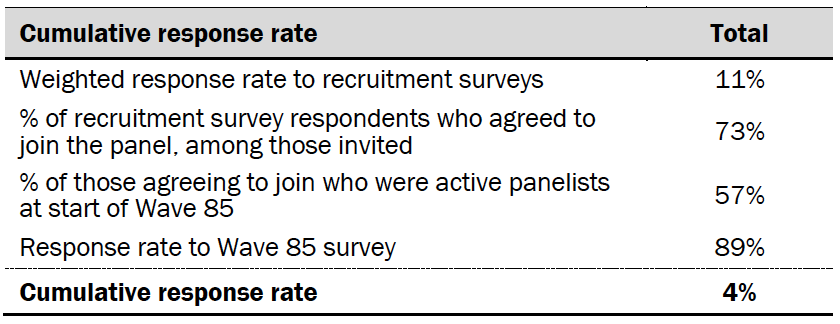
Data in this report is drawn from the panel wave conducted March 8 to March 14, 2021. A total of 12,045 panelists responded out of 13,540 who were sampled, for a response rate of 89%. This does not include five panelists who were removed from the data due to extremely high rates of refusal or straightlining. The cumulative response rate accounting for nonresponse to the recruitment surveys and attrition is 4%. The break-off rate among panelists who logged on to the survey and completed at least one item is 1%. The margin of sampling error for the full sample of 12,045 respondents is plus or minus 1.5 percentage points.
This is the latest report in Pew Research Center’s ongoing investigation of the state of news, information and journalism in the digital age, a research program funded by The Pew Charitable Trusts, with generous support from the John S. and James L. Knight Foundation.
Panel recruitment
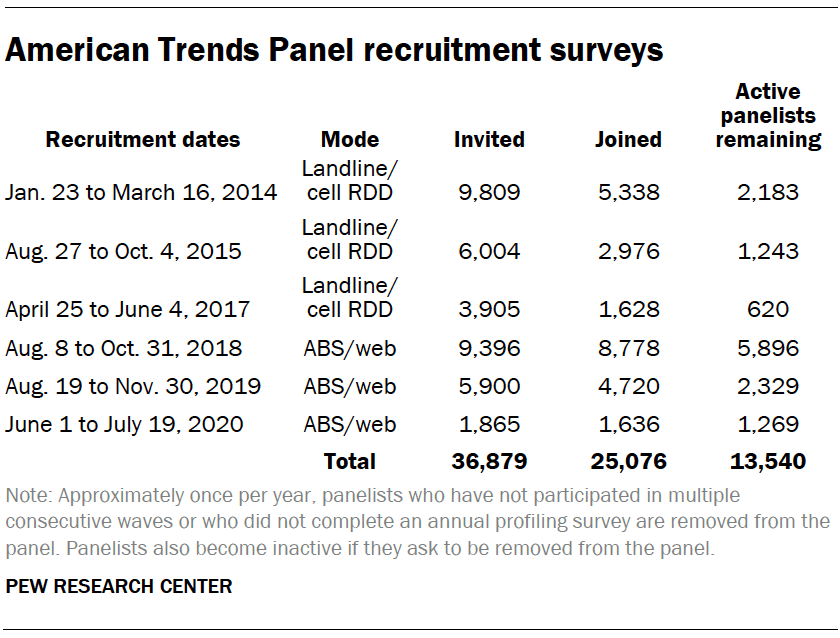
The ATP was created in 2014, with the first cohort of panelists invited to join the panel at the end of a large, national, landline and cellphone random-digit-dial survey that was conducted in both English and Spanish. Two additional recruitments were conducted using the same method in 2015 and 2017, respectively. Across these three surveys, a total of 19,718 adults were invited to join the ATP, of whom 9,942 (50%) agreed to participate.
In August 2018, the ATP switched from telephone to address-based recruitment. Invitations were sent to a random, address-based sample of households selected from the U.S. Postal Service’s Delivery Sequence File. Two additional recruitments were conducted using the same method in 2019 and 2020, respectively. Across these three address-based recruitments, a total of 17,161 adults were invited to join the ATP, of whom 15,134 (88%) agreed to join the panel and completed an initial profile survey. In each household, the adult with the next birthday was asked to go online to complete a survey, at the end of which they were invited to join the panel. Of the 25,076 individuals who have ever joined the ATP, 13,540 remained active panelists and continued to receive survey invitations at the time this survey was conducted.
The U.S. Postal Service’s Delivery Sequence File has been estimated to cover as much as 98% of the population, although some studies suggest that the coverage could be in the low 90% range.4 The American Trends Panel never uses breakout routers or chains that direct respondents to additional surveys.
Sample design
The overall target population for this survey was non-institutionalized persons ages 18 and older, living in the U.S., including Alaska and Hawaii.
Questionnaire development and testing
The questionnaire was developed by Pew Research Center in consultation with Ipsos. The web program was rigorously tested on both PC and mobile devices by the Ipsos project management team and Pew Research Center researchers. The Ipsos project management team also populated test data which was analyzed in SPSS to ensure the logic and randomizations were working as intended before launching the survey.
Incentives
All respondents were offered a post-paid incentive for their participation. Respondents could choose to receive the post-paid incentive in the form of a check or a gift code to Amazon.com or could choose to decline the incentive. Incentive amounts ranged from $5 to $20 depending on whether the respondent belongs to a part of the population that is harder or easier to reach.
Differential incentive amounts were designed to increase panel survey participation among groups that traditionally have low survey response propensities.
Data collection protocol
The data collection field period for this survey was March 8 to 14, 2021. Postcard notifications were mailed to all ATP panelists with a known residential address on March 8, 2021.
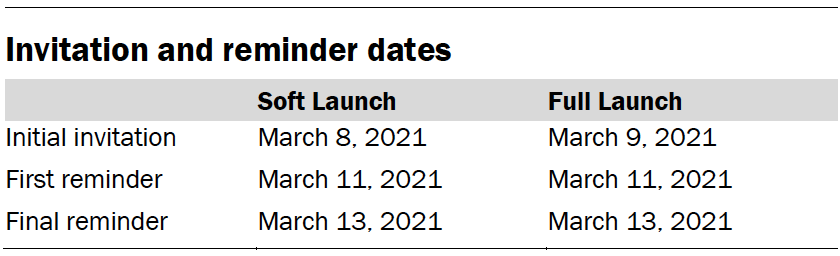
On March 8 and March 9, invitations were sent out in two separate launches: Soft Launch and Full Launch. Sixty panelists were included in the soft launch, which began with an initial invitation sent on March 8. The ATP panelists chosen for the initial soft launch were known responders who had completed previous ATP surveys within one day of receiving their invitation. All remaining English- and Spanish-speaking panelists were included in the full launch and were sent an invitation on March 9.
All panelists with an email address received an email invitation and up to two email reminders if they did not respond to the survey. All ATP panelists that consented to SMS messages received an SMS invitation and up to two SMS reminders.
Data quality checks
To ensure high-quality data, the Center’s researchers performed data quality checks to identify any respondents showing clear patterns of satisficing. This includes checking for very high rates of leaving questions blank, as well as always selecting the first or last answer presented. As a result of this checking, five ATP respondents were removed from the survey dataset prior to weighting and analysis.
Weighting
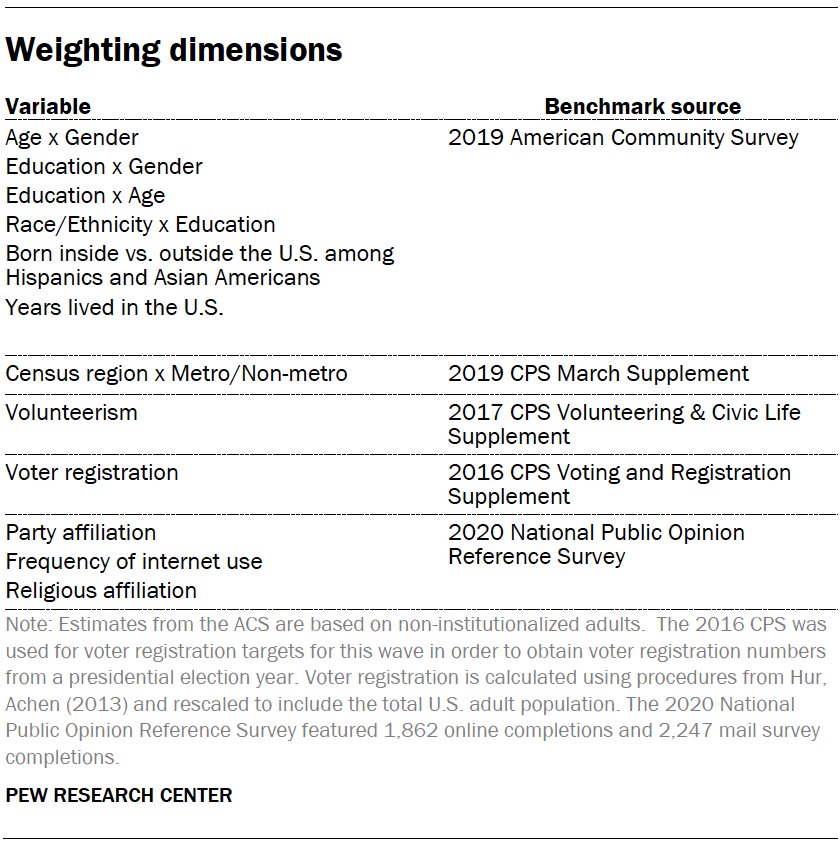
The ATP data was weighted in a multistep process that accounts for multiple stages of sampling and nonresponse that occur at different points in the survey process. First, each panelist begins with a base weight that reflects their probability of selection for their initial recruitment survey (and the probability of being invited to participate in the panel in cases where only a subsample of respondents were invited). The base weights for panelists recruited in different years are scaled to be proportionate to the effective sample size for all active panelists in their cohort. To correct for nonresponse to the initial recruitment surveys and gradual panel attrition, the base weights for all active panelists are calibrated to align with the population benchmarks identified in the accompanying table to create a full-panel weight.
For ATP waves in which only a subsample of panelists are invited to participate, a wave-specific base weight is created by adjusting the full-panel weights for subsampled panelists to account for any differential probabilities of selection for the particular panel wave. For waves in which all active panelists are invited to participate, the wave-specific base weight is identical to the full-panel weight.
In the final weighting step, the wave-specific base weights for panelists who completed the survey are again calibrated to match the population benchmarks specified above. These weights are trimmed (typically at about the 1st and 99th percentiles) to reduce the loss in precision stemming from variance in the weights. Sampling errors and test of statistical significance take into account the effect of weighting.
The following table shows the unweighted sample sizes and the error attributable to sampling that would be expected at the 95% level of confidence for different groups in the survey.
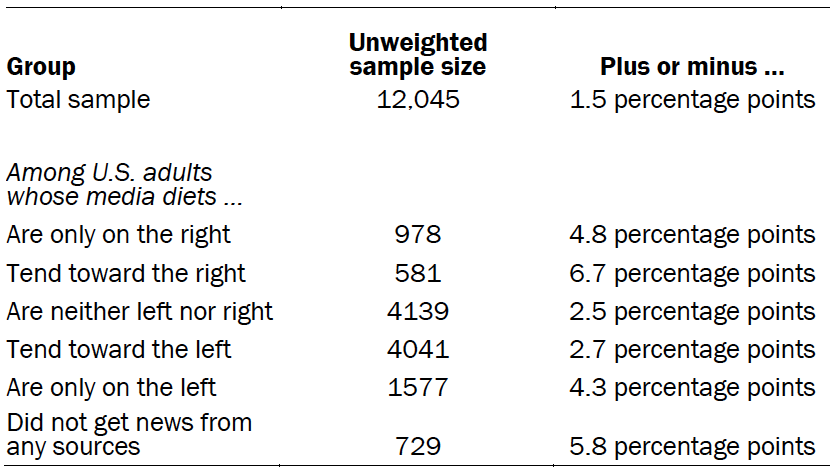
Sample sizes and sampling errors for other subgroups are available upon request. In addition to sampling error, one should bear in mind that question wording and practical difficulties in conducting surveys can introduce error or bias into the findings of opinion polls.
Dispositions and response rates
© Pew Research Center, 2021


