The study involved five separate research methodologies in each city, each of which is detailed below.
City Selection Process
The three cities studied as a part of Local News in a Digital Age are not meant to be representative of the United States as a whole, but rather serve as detailed case studies of local news in three specific, unique areas in the U.S. The process for selecting the combination of these three cities followed precise and detailed steps outlined below.
The sampling frame consists of 210 designated market area (DMA) regions, as defined by Nielsen.43 First, the list of DMAs was divided into thirds:
- 1-70: Large cities
- 71-140: Medium cities
- 141-210: Small cities
The top 15 DMAs (1-15) were eliminated because the inventory and content collection would be too arduous, it would be extremely difficult to achieve a complete account and working explanation of the media environment, and many of these cities (Philadelphia, Chicago) have been the subjects of similar academic inquiries. Also eliminated were the following: DMAs that contained multiple cities (as that would conflate our unit of analysis); areas in which newspapers do not publish daily; Alaska and Hawaii due to cost constraints; Columbia, South Carolina, because it was announced at the time as the FCC pilot city; and Madison, Wisconsin, because the University of Wisconsin has conducted similar research there.
Following this logic, the first 10 cities in each DMA grouping were selected as potential candidates for inclusion in the study. The variables used to evaluate each city included:
- Population size
- Geographic location
- Demographics
- Broadband penetration (by county)
- Presence of TV affiliates
- Newspaper circulation size
- Community newspapers
- Alt-weeklies
- Ethnic newspapers
- Nonprofit news outlets
- NPR stations (producing original content)
- Presidential election results (by county) in 2004, 2008 and 2012
- Presence of a community foundation
- Median income/income distribution
- Unemployment rate
- John S. and James L. Knight Foundation “resident city”
With an interest in having diversity across the variables listed above, multiple city combinations were considered. The team of researchers settled on Denver, Colorado; Macon, Georgia; and Sioux City, Iowa, based on the following key attributes.
- Consideration of population density.
As most of Americans live in urban areas, the inclusion of Denver enables an examination of how news diffuses through a metropolitan ecosystem. The addition of smaller cities—Macon and Sioux City—to the mix will help fill a gap in the scholarly literature. Prior studies have almost exclusively focused on large cities. Therefore, by expanding this study to include smaller localities, we can greatly broaden the understanding of how news is produced and consumed within local communities.
- Stratification of geographic/demographic variables.
Denver, Macon and Sioux City target three distinct geographic segments of the country (West, South and Midwest). Furthermore, these cities are demographically diverse, adding another dimension to our analysis.
- Inclusion of a “Knight resident city.”
In light of the association with Knight Foundation, the project aimed to include at least one Knight resident city. Many of these Knight resident cities are large metropolitan regions that would be unwieldy for the current research. In addition, several of the Knight locations have previously been the subject of similar ecological research. Macon, then, is a manageable-sized Knight resident city that also meets the other criteria and provides city characteristics distinct from Denver and Sioux City.
- Inquiry of emergent sectors/news nonprofit.
To reflect the fluid landscape of news production in the digital age, the project sought to include a city with considerable entrepreneurial energy—a region in which newsgatherers are experimenting with new business and delivery models. As news nonprofits gain ground, we purposely selected a location in which this type of activity would be present. As detailed below, Denver’s media market is emblematic of such journalistic innovation.
Survey
Much of the analysis in this report is based on surveys conducted July 8 through August 18, 2014, in the metropolitan statistical areas (MSAs) of Denver, Colorado (N=1,043); Macon, Georgia (N=1,387); and Sioux City, Iowa (N=1,191). An MSA is a Census-designated area consisting of the named city as well as towns and cities in the surrounding vicinity. The survey was conducted by hard-copy paper and pencil questionnaires mailed to respondents’ homes. The questionnaire, which was developed by researchers at the Pew Research Center, primarily asked respondents about their attitudes and consumption of local news in their city. The survey was conducted by SSRS.
An addressed-based sample was used. The sample in each city was generated by Marketing Systems Group (MSG). A list of addresses within each MSA was drawn from the U.S. Postal Service’s Computerized Delivery Sequence File (CDSF) and divided into strata. The stratification accommodated clustering of ethnic/racial groups and younger residents, specifically blacks, Hispanics, and those under 35 years of age. A random sample was then drawn from each strata with oversamples in strata whose populations are harder to reach (e.g. non-whites and younger respondents).
All respondents received an initial mailing containing a one-page cover letter, a $2 prepaid incentive, a questionnaire in English and a postage-paid return envelope. Respondents from high-density Hispanic strata in Denver and Sioux City were also provided with a questionnaire translated into Spanish. In addition to the eight-page questionnaire, respondents were provided with a card listing local news sources that were used to complete several of the questions. Reminder postcards were sent to non-respondents to the first mailing. Finally, a second full mailing was sent to any remaining non-respondents, which contained the same contents as the first mailing with the exception of the incentive. Mailings were addressed to “Recipient” rather than any individual member of the household. Respondents were instructed to have the adult (18 years or older) who has had the most recent birthday complete the survey. The results are representative of randomly selected adults living in households within each MSA.
The samples for each city were weighted separately through a multi-step process. Responses were weighted to account for their probability of selection and non-response by strata, including oversampling in certain strata, and the number of adult residents in the household. Following this, a post-stratified weight was calculated using an iterative technique that matches gender, age, education, race and Hispanic origin to parameters from Claritas from the first quarter of 2014. Claritas utilizes U.S. Census data with other sources to update Census counts each quarter from release of each Census to the next one. Sampling errors and statistical tests of significance take into account the effect of weighting.
The response rate for each city was as follows: Denver, 24%; Macon, 23%; and Sioux City, 28%.
The following table shows the unweighted sample sizes and the error attributable to sampling that would be expected at the 95% level of confidence for different groups in the survey:
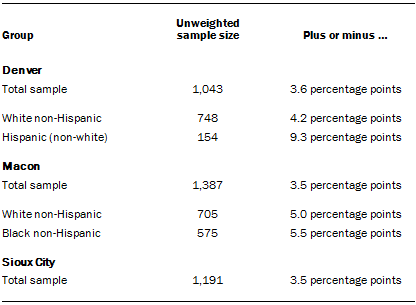
Sample sizes and sampling errors for other subgroups are available upon request.
In addition to sampling error, one should bear in mind that question wording and practical difficulties in conducting surveys can introduce error or bias into the findings of opinion polls. For detailed information about our survey methodology, see https://www.pewresearch.org/packages/about-our-research-methods/
Content Analysis
One portion of Pew Research Center study Local News in a Digital Age was an analysis of news coverage produced over a snapshot period of five days in 2014. The specific dates for each city overlapped with the survey field time. They were: Macon, June 9-13; Denver, June 16-20; and Sioux City, June 23-27.
Human Coding of News Media
Sample Design
News providers were included in the five-day analysis if they published original local content at least once a week. There were two main exceptions.
- Outlets dedicated solely to sports news coverage were accounted for as news providers but not included in the content sample.
- In the Denver area, researchers discovered 28 weekly community papers, plus one daily community paper (the Aurora Sentinel). Many of the weekly papers share some content. Due to the large number, six of the papers were included in the sample to represent the content included in community papers in general.
Four of the weekly papers included were ones in the most populated suburban communities and are part of the Colorado Community Media company: Lakewood Sentinel, Westminster Window, Centennial Citizen and Highlands Ranch Herald. These four weekly papers share some, but not all, content. Also included were the one weekly based within the city limits, The Villager Newspaper, and the one suburban daily, the Aurora Sentinel. Each of the five weekly papers that were included averaged around 10 unique local stories during the week studied. Based on that average, the best estimate is that the inclusion of those other hyperlocal outlets would have added roughly 6% to the total number of stories studied in the Denver sample.
In addition, a few outlets could not be captured due to technical reasons.44
In total, 81 providers were included in this sample for content analysis: 52 from Denver, 17 from Sioux City and 12 from Macon. In all, 6,416 stories were captured and coded.
For outlets that had multiple platforms, such as a TV station with a website, researchers captured and coded stories from both platforms. The data in the report combine stories from all platforms captured. For example, the broadcast news programs on Denver station CBS Denver were included, along with stories appearing on the website denver.cbslocal.com. (In a few instances, only one platform was available. See list of providers below for details about which platforms were included.)
Content Capture
Every effort was made to collect the entirety of the content from each provider in its primary form.
For print publications such as magazines and newspapers, whenever possible, hard copies were delivered to the center’s Washington, D.C., office. Some print publications had digital versions of their entire print version on their websites, and in those cases researchers used those versions. In a few cases, neither a hard copy nor a digital version of the hard copy was available. In those instances, stories posted on the outlet’s website were used.
For web-only publications, researchers manually captured and saved digital versions of the websites each morning between 9 and 11 a.m. ET. Each site’s home page was captured, along with all inside landing pages that included regular local news. For example, for the Aurora Sentinel, the home page was captured along with the following inside sections: News, Metro Aurora News, Aurora Business, Colorado News, Holmes Trial, Your News, Opinion, Sports, Aurora Preps, College Sports, Pro Sports, Guide, Colorado Table, Wellness, Music, Screen, Stage & Comedy, and Travel.
To view and analyze the local television broadcasts in each city, the center used the media monitoring service Critical Mention, which records and saves all original local content on stations around the country. The independent Macon television station WPGA was not available on Critical Mention. Therefore, web content only was included for this station.
Radio shows were captured through online feeds on the stations’ websites when such feeds existed. Researchers captured programs that featured local content according to the information available on their websites. For news or talk shows that were two hours long, the first hour of the broadcast was captured. For shows that were three hours or longer, the first two hours were included.
For three Denver stations—KGNU, KHOW and Colorado Public Radio—no online feed was available. Instead, the available podcasts of their local programming were captured and studied as well as relevant website stories. In all three instances, the podcasts included the majority of each station’s local news programming.
For the local affiliates of National Public Radio, local news inserts that appeared during the breaks of NPR’s national programming were captured and studied.
The following are the providers included in this analysis along with the platforms that were captured:
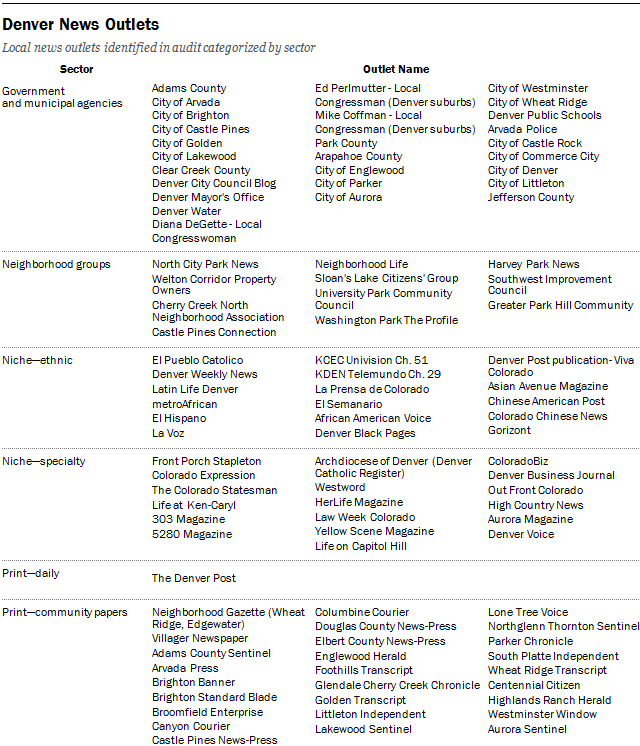
Denver
Daily newspaper
The Denver Post (print and website)
Television
- KMGH ABC 7 (TV and website)
- 6-7 a.m., 5-5:30 p.m., 10-10:30 p.m.
- KCNC CBS Denver (TV and website)
- 6-7 a.m., 6-7 p.m., 10-10:30 p.m.
- KDVR Fox 31 (TV and website)
- 8-9 a.m., 5-6 p.m., 9:30-10 p.m.
- KWGN CW (TV and website)
- 8-9 a.m., 7-8 p.m.
- KUSA NBC 9 (TV and website)
- 6-7 a.m., 5-5:30 p.m., 6-6:30 p.m., 10-10:30 p.m.
- Rocky Mountain PBS (website only)
Radio
- Colorado Public Radio (radio and website)
- Entirety of the local podcasts, usually 20-30 minutes each weekday
- KGNU radio (radio)
- Entirety of the local podcasts, usually 35-40 minutes each weekday
- KHOW (radio and website)
- First 2 hours of the podcast version of the Mandy Connell show, which airs 5-10 a.m.
- KOA radio (radio and website)
- First 2 hours of the podcasts versions of Colorado Morning News, which airs 5-7 a.m.
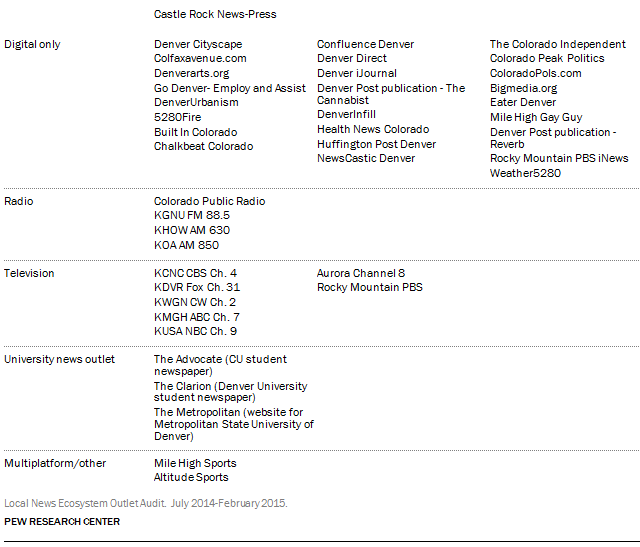
Digital only
- 5280Fire
- Bigmedia.org
- Built In Colorado
- The Cannabist—Denver Post publication
- Chalkbeat Colorado
- The Colorado Independent
- Confluence Denver
- Denver Direct
- Denver iJournal
- Denver Infill
- Health News Colorado
- Huffington Post Denver
- NewsCastic Denver
- Weather5280
Ethnic publications
- Asian Avenue Magazine (print)
- El Hispano (print)
- El Pueblo Catolico (print)
- La Prensa de Colorado (print)
- La Voz (website and print)
- KDEN Telemundo (TV and website)
- 5:30-6 p.m., 10-10:30 p.m.
- KCEC Univision Colorado (TV and website)
- 10-11 p.m.
- Viva Colorado (website and print)
Specialty publications
- 303 Magazine (print and website)
- 5280 [The Denver Magazine] (print and website)
- The Colorado Statesman (print)
- ColoradoBiz (print)
- Denver Business Journal (print)
- Archdiocese of Denver (Denver Catholic Register) (print and website)
- Denver Voice (print)
- Westword (print and website)
- HerLife Magazine (print)
- Law Week Colorado (print)
- Out Front Colorado (print)
- Yellow Scene Magazine (print)
Community papers
- Aurora Sentinel (website)
- Colorado Community Papers (websites only)
- Lakewood Sentinel
- Westminster Window
- Centennial Citizen
- Highlands Ranch Herald
- The Villager Newspaper (online)
University news outlets
The Metropolitan (website for Metropolitan State University of Denver)
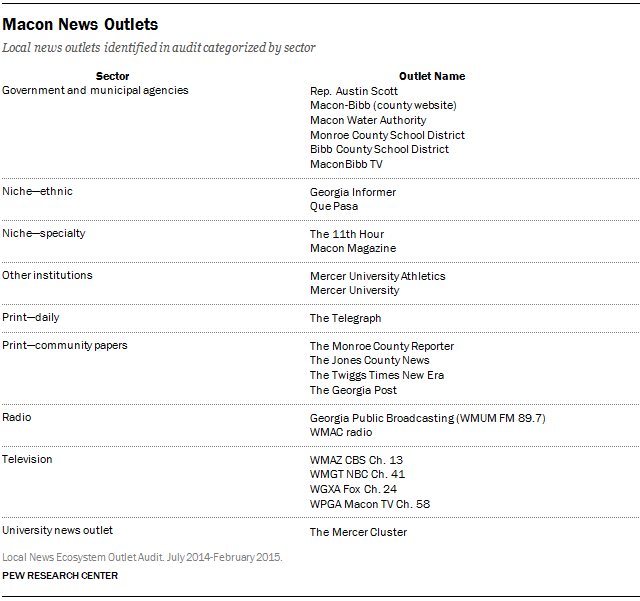
Macon
Daily newspaper
The Telegraph (print and website)
Television
- WGXA Fox/ABC (TV and website)
- 8-9 a.m., 5-6 p.m., 10-10:30 p.m.
- WMAZ CBS (TV and website)
- 6-7 a.m., 5-5:30 p.m., 6-6:30 p.m., 11-11:30 p.m.
- WMGT (TV and website)
- 6-7 a.m., 6-6:30 p.m., 11-11:30 p.m.
- WPGA (website only)
Radio
- WMUM FM 89.7 GA Public Broadcasting (radio and website)
- 6-8:30 a.m., 4-6:30 p.m.
Specialty publications
- The 11th Hour (print)
- Macon Magazine (print)
Community papers
- The Georgia Post (print)
- The Jones County News (print and website)
- The Monroe County Reporter (print)
- The Twiggs Times New Era (print)
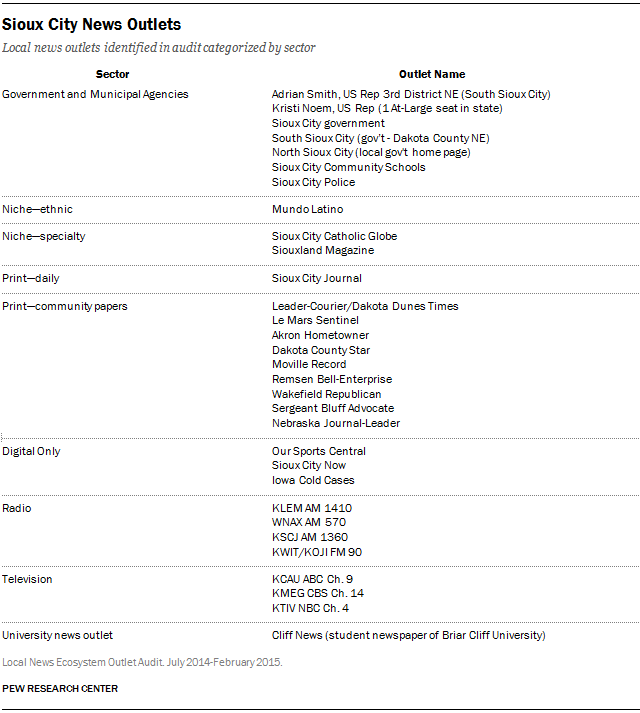
Sioux City
Daily newspaper
Sioux City Journal (print and website)
Television
- KCAU ABC (TV and website)
- 6-7 a.m., 5-5:30 p.m., 6-6:30 p.m., 10-10:30 p.m.
- KMEG CBS (TV and website)
- 6-7 a.m., 5-5:30 p.m., 10-10:30 p.m.
- KTIV NBC (TV and website)
- 6-7 a.m., 5-5:30 p.m., 6-6:30 p.m., 10-10:30 p.m.
Radio
- KLEM AM Le Mars (radio and website)
- 6-8 a.m.
- KSCJ (radio and website)
- 6-7 a.m., 8-9am, 10-11 a.m.
- KWIT/KOJI FM – NPR affiliate (radio)
- 6-9 a.m.
- WNAX radio (website only)
Ethnic publications
Mundo Latino (print)
Specialty publications
- Sioux City Catholic Globe (print and website)
- Siouxland Magazine (print)
Community papers
- Akron Hometowner (print)
- Dakota County Star (print and website)
- Le Mars Daily Sentinel (print and website)
- Leader-Courier/Dakota Dunes Times (print and website)
- Moville Record (print)
- Remsen Bell-Enterprise (print)
Story Selection
The unit of analysis for this study was the story.
For all the providers collected, news stories that were focused on local events or broader issues with a local element were included in the study. If 50% or more of the time or space of a story was focused on events beyond the surrounding area, the story was excluded from the study. Also excluded were advertisements, calendars and other standard components of print publications such as weather forecasts.
Stories produced during the five-day period were examined. If content appeared on a website during the week but was originally produced prior to the start of our study, it was not included.
For print publications that also had websites, stories that appeared in both places were included in the study once, as long as the text of the article was identical in each location.
Four weekly community papers in Denver—the Lakewood Sentinel, Westminster Window, Centennial Citizen and Highlands Ranch Herald—are all part of the Colorado Community Media company and shared some, but not all, content. Stories that appeared in more than one of the papers were counted once in our sample.
For websites, every story that appeared on the home page of the site was coded, along with the top three stories located on the inside pages (as long as they were not duplicates of stories on the home page). Weather widgets or other automated elements such as sports scores or stock information were excluded.
For broadcast content, every local story that appeared during the time frame examined was coded. For television stations that offered more than one news program per day, the latest hour of local news broadcast in the mornings, the latest hour of early evening news if it existed (5-7 p.m.), and 30 minutes of the late night news (10 p.m. or later) were included.
For all Spanish-language content, both broadcast and print stories, a fluent Spanish speaker translated the articles into English so that a member of the coding team could analyze each story accordingly.
Note: All local stories that met the above criteria were captured and coded, regardless of topic. Due to the prevalence and commonality of sports, traffic and weather forecast stories, much of the data in the report are reported excluding those three topics. The report notes whether each data reference includes or excludes those categories of stories.
Story Codes
The data in this study were created by a team of six experienced coders under supervision by a senior researcher.
The method of coding was the same that had been used in many previous Pew Research studies and has been refined over years of research.
Word Counts
To determine the word counts for print and online stories, whenever text was available in a digital format, researchers copied the text into Microsoft Word and recorded the result. When text was available only in hard copy, researchers counted the number of lines in the story and estimated the total word count accordingly.
For online stories that had audio and/or video components, the word count value was determined by adding the number of words in text to a value derived from the length of the audio or video piece. To arrive at that value, the length of the story in seconds was multiplied by four. Therefore, a 30-second long video would be given a value of 120 words. Pew Research has tested this method before and found it is an effective way to weight online videos accurately. (Some websites included long videos that lasted 30 minutes or more. Any video that came to a value of more than 10,000 was changed to equal 10,000 so that no single page had a disproportionate impact on the overall totals.)
Intercoder Testing
Each coder trained with a senior researcher for approximately two weeks to learn the codebook for this project.
All “housekeeping” variables (such as source, date, byline, start time, end time and format) have been used in many previous Pew Research studies and tested on numerous occasions. Those variables each consistently reach a level of agreement of at least 80%, and usually much higher.
To demonstrate the validity of the coding rules that were specific for this project, intercoder testing was conducted on all the complex variables.
For the following codes, 33 randomly selected stories were coded by all members of the coding team. The percent of agreement on each variable was:
- Dateline—85%
- Word count—87%
- Reported story vs. opinion/commentary: 92%
- Geographic focus—81%
- Broad story topic—83%
- Story trigger—84%
- Big story/major storyline—100%
- Citizen engagement—91%
- Embedded links (online only)—87%
- Referral to other internal content—95%
- Referral to external content—90%
- Presence of the 30 different categories of sources cited (combined)—95%
One of the biggest challenges for coding broadcast content is how to break up stories during various news segments. Pew Research has perfected a method to do this over years of reports. However, it is important to conduct tests to for every project to ensure consistency. For this project, all coders were given three separate television shows to code, and 89% of the time they agreed on how to break up the stories.
Identification of News Providers and Website Audit
This report—a study of the local news ecosystem in three American cities—involved a number of different research components, including a survey of residents, content analysis, social media data-mining, site visits and direct interviews.
One of the initial steps involved the identification of news providers in each locale (Denver, Macon and Sioux City). After news providers were identified and cataloged, researchers conducted an audit of their websites.
Provider identification began in May 2014 and was largely concluded in July, though a handful of providers were discovered later and added to the study. The majority of audits were conducted in July 2014, with additional audits conducted between September 2014 and February 2015.
Identification of the Universe of Local News Providers
Researchers took several steps to identify the universe of local news providers in each of the three metropolitan areas. The goal was to identify not only the traditional providers that were a part of the mainstream legacy media (newspapers, magazines, local TV stations, commercial and public radio) but also digital-only news websites, blogs, and civic and political institutions that provide some original news amid their other offerings. The various steps, which overlapped some in timing, were as follows:
Database Aggregation: Analysts consulted existing lists and databases of news outlets compiled by external sources as well as those that had been produced for earlier Pew Research projects. Among the sources consulted were:
- J-Lab Knight Community News Network
- Michele McLellan’s list of promising local news sites
- Nieman Journalism Lab Encyclo
- Columbia Journalism Review Guide to Online News Startups
- Investigative News Network member list
- Editor & Publisher Data Book
- BIA/Kelsey
Local Leader Consultation: Researchers consulted with local leaders in the business, philanthropic and academic communities for information about key local news providers in each respective city.
Web Searches: Researchers conducted multipronged web searches with standardized search terms to identify any other possible of news providers in each city.
[city name]
[town]
[city name]
- Politics
- Government
- Crime
- Business
- Real estate
- Environment
- Transit
- Transportation
- Education
- Religion
- Health
- Technology
- Tech
- Gay
- Gay and lesbian
- African American/Hispanic
- Senior citizen
- Labor
- Homelessness/homeless
- Immigration
- Entertainment
- Arts
- Music
- Traffic
- Sports
- Weather
Researchers also searched for potential news providers among a range of civic and municipal organizations in each of the three metropolitan areas using the following standardized list:
- Regional government
- City/County government
- Mayor/City council
- Public schools/Board of Education
- Emergency management/Weather
- Firefighting
- Police
- Public utilities (water, gas, electric)
- Chamber of Commerce
- Visitors and/or Convention Center
- Parks and Recreation
- Airport
- Public transportation (bus, rail)
Analysts conducted similar broad web searches to identify state-level news outlets that may have been producing news about the Denver, Macon or Sioux City metropolitan areas.
Blogger identification: In addition to these targeted web searches, researchers specifically queried two popular blogging platforms—blogspot.com and wordpress.com—for each city. Using Google’s advanced search tool, we searched each platform using the city and state names. To prevent restaurant websites from clouding our searches, our results filtered out webpages that contained the word “menu.” For each city, the top 200 results were reviewed. At that point, the decision to continue was based on whether any of the last 40 results had yielded a webpage that met criteria for inclusion. As a result, in Denver, the top 530 blogging websites on these platforms were reviewed. In addition, we then queried the local newspaper archives to examine whether they had cited a local blog in the past.
News Provider Classification
The assessment of whether or not to include an outlet as a news provider was based on the following predetermined set of guidelines.
A local news provider was included in the study if all of the following criteria were met:
- It produced original content, including news reports, multimedia, commentary or analysis that was produced by the outlet being analyzed
- It had published within the past 30 days
- It provided timely content of interest to the local community—accounts of events and issues that matter to Denver, Macon, Sioux City and their surrounding suburbs
- If a state-level provider, it had published news about the local community of interest within the previous seven days
- Blogs or verticals within a legacy outlet that had a standalone website independent of the legacy parent
Researchers excluded outlets that were primarily listings of entertainment events or sports scores, public relations vehicles, advocacy organizations, local businesses or news aggregators.
In all, analysts identified a total of 198 outlets: 143 in Denver, 24 in Macon and 31 in Sioux City. Of these, the websites of 170 were analyzed further, in an audit.
Website Audit Protocol
Pew analysts audited the websites of all identified news providers—or a modified audit in cases where outlets had only a minimal web presence or none at all—using a codebook specifically designed for this phase of the study. The codebook had a total of 13 variables:
- Source (name of outlet)
- Date of audit
- Link to website home page
- Frequency of updates: How often was the website updated with local news content? For example, was it updated several times a day, at least daily, several times a week, etc.
- Volume of original content: How much original content appears on the home page? Were there 1-5 stories, 6-10 stories, 11-20 stories or more than 20 stories?
- Level of original content: What was the level of original content on the home page within the last week? Was it all original content, some original content, or none?
- Type of news outlet or organization: Classifies the outlet as print, television, radio, digital only, multiplatform/other.
- Geographic focus of outlet: Does the outlet typically focus on news that is single- neighborhood, multiple neighborhoods, city or county-wide, or statewide?
- Focus of coverage: What is the primary focus of coverage of the outlet? Is it general interest news, politics and government, sports, lifestyle, public services, education, crime, business, religion or other?
- Requests for user-generated content: Does the outlet provide a vehicle for community engagement, and if so, in what form? For example, options for community engagement included a comment section, a discussion section, a place to invite user tips or a place on the site for citizen-generated content.
- Video/audio: Is video or audio available on the home page?
- Open data: Are there any open data sets available on the home page, and if so, what kind?
- Facebook/Twitter presence: Does the outlet have a presence on Facebook and/or Twitter? If so, has there been any activity within the past seven days?
Social Media
As a part of the Local News in the Digital Age project, Pew Research Center examined two social networks—Facebook and Twitter—to better understand how local news is shared and discussed on social media. Both of these sites present different research challenges. The same procedures were followed for each of the three cities included in this project.
The social media landscape is complex and large, making it difficult to provide a completely exhaustive account even for an individual town or city. The steps detailed here were taken to reliably identify as many Twitter accounts, webpages, blogs and organizations that are active on social media. While there may be some omissions, they are few and far between and are unlikely to significantly alter the analysis.
The goal of this portion of the project was to analyze conversations on Twitter that occurred in the three geographic areas studied. However, location data from tweets is sparse and unreliable. Previous studies suggest about 2% or fewer of Twitter users have opted in to the feature that geotags their tweets.
Most studies that rely on this geotagging are able to map only a small portion of the activity on Twitter. For this study, researchers attempted to get as full a picture of all Twitter activity in the given areas. Researchers used a thorough strategy to gather as many tweets as possible, even if they had no geographic metadata available.
Researchers began the process by creating a list of Twitter handles gathered from the audit portion of the media ecosystems project. This list consists of all the Twitter handles we could find for news organizations, government entities, schools, neighborhood associations and any other organization connected to the community that was included in the audit and had a Twitter handle. For this initial list there were 109 handles in Denver, 19 in Sioux City and 22 in Macon. This list is referred to as the “audit list” below.
All Twitter data were pulled using the Twitter “firehose,” which is Twitter’s application programming interface (API) access to all tweets and associated metadata. Access to the firehose was provided to the Pew Research Center by GNIP.
From there researchers took the following steps:
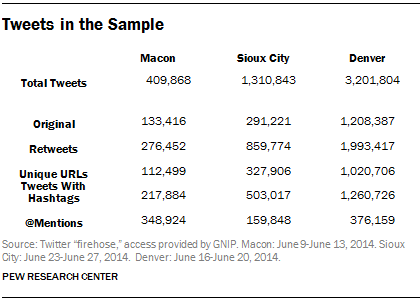
- Researchers pulled all of the tweets from the audit list. Researchers collected the tweets for the same five-day range for each city on which the content analysis took place in 2014 (Macon, June 9-13; Denver, June 16-20; Sioux City, June 23-27). There are restrictions on how much data can be pulled from the Twitter firehose at any given time. These time periods were chosen to limit the total amount of data pulled, as well as coincide with the content analysis portion of the study.
- Researchers analyzed the resulting corpus of tweets for any Twitter handles that either @mentioned a handle in the audit list or retweeted a tweet from the audit list. This resulted in roughly 30,000 new Twitter handles across the three cities. All of the tweets were then pulled for these new handles for the same date range noted above. This method is sometimes referred to as “snowball sampling” or “chain sampling.”
This process created a very large corpus of around 4.7 million tweets across the three cities.
Many of the tweets were not related to the geographic areas being studied. Researchers then applied several filters to the data set. The goal was to narrow the Twitter conversation as much as possible to “local” news and discussion of local topics or events. To further refine this process we eliminated Twitter handles and tweets using several criteria:
- Tweets not in ASCII characters (this would include languages such as Arabic or Chinese).
- Tweets sent from outside the United States (based on the small minority of tweets that were geotagged).
- Twitter handles self-identified as living outside the United States.
- Tweets in each city were analyzed using a tool designed by the analytics company Crimson Hexagon to determine the top hashtags and terms being used during the time frame. (For Macon, additional analysis was done in Excel with researchers reading each tweet and associated metadata. Sioux City and Denver had far too many tweets for this method.) From those results a list of terms was created to exclude tweets based on topics that were obviously national or international in nature and therefore not locally oriented. For example, the World Cup was happening during the time period so #worldcup tweets were removed.
Once these tweets were collected and culled, researchers used several tools to help analyze this large data set. Part of the analysis was done in Excel and part was done in the statistical package R, which was used to handle a much larger volume of tweets than is possible in Excel.
The study of Facebook provides different challenges than the study of Twitter. What content is accessible to the public, and therefore accessible for this study, is up to each Facebook user individually.
To analyze the diffusion of news stories across on Facebook in the three cities, researchers began with targeted news pages as a point of entry. Researchers collected our corpus of related Facebook pages through Facebook’s API.
Researchers first conducted targeted searches on Google for each town and possible news topics (e.g. “Macon politics,” “Macon health”). Researchers also searched blogspot.com and wordpress.com, two of the most popular blog domains, for “Macon Georgia,” or the name of the respective town. After identifying whether the webpages within these search results contained local news, we identified whether any of the relevant websites had Facebook pages.
To supplement our initial list, researchers attempted to find additional pages through Facebook’s search function. However, the results were difficult to navigate. Facebook’s search is designed to give personalized results depending on the searcher. Therefore, researchers used Google’s advanced search function to search Facebook’s domain for “Macon Georgia news” and “Macon Georgia community.” The identical search process was used for Sioux City and Denver. The results captured Facebook pages of organizations that likely had a large presence on Facebook in the correct geographic areas.
Lastly, researchers used the initial list of page’s “likes” to create a snowball sample of Facebook pages for related politicians, journalists, news personalities and public figures whom we did not previously have. This is a similar tactic to what was done with Twitter. It was an attempt to find accounts connected to the audit list, in the case of Facebook using “likes.” The analysis contains data collected from this corpus.
It is important to note that there will be a small number of comments that cannot be captured due to individual privacy settings or deletions. There are also a small number of posts that will have been deleted or changed between the captures of Facebook pages, creating minor differences between the post counts for the various levels of granularity of the data. Because the differences are so small, they will not significantly alter our analyses.
Using the public Facebook API, researchers gathered up to 250 of the most recent posts to the target Facebook pages within the time window. Researchers also limited collection to 5,000 comments per individual post. The data include posts from page administrators and, if the administrators allowed, individuals who may also post on the pages.
Macon
- Researchers collected data for posts to targeted Facebook pages made June 4-18, 2014, a two-week window including a few days before and after the five-day target time of June 9-13, when the content analysis portion of the study was conducted.
- The data were collected on July 28-29 using the public Facebook API.
- The corpus includes 65 pages, with 17 of those pages having zero posts within our time frame, resulting in 48 pages for further analyses.
- The 48 pages include 1,829 posts, 4,475 commenters, and 7,608 comments. A total of 259 comments could not be captured due to privacy settings or deletion, resulting in the content of 7,349 comments.
Denver
- Researchers collected data for posts to targeted Facebook pages made June 11-25, 2014, a two-week window including a few days before and after the five-day target time of June 16-20, when the content analysis portion of the study was conducted.
- The data were collected July 25-27 using the public Facebook API.
- The corpus includes 186 pages, with 46 of those pages having zero posts within the time frame, leaving us with 140 pages for further analyses.
- The 186 pages include 4,785 posts, 20,693 commenters and 40,989 comments. A total of 11 posts and 4,448 comments could not be captured due to privacy settings or deletion, resulting in the content of 4,774 posts and 36,541 comments.
Sioux City
- Researchers collected data for posts to targeted Facebook pages made June 18-July 2, 2014, a two-week window including a few days before and after the five-day target time of June 23-27, when the content analysis portion of the study was conducted.
- The data were collected August 25-27.
- The corpus includes 50 pages, with three of those pages having zero posts within the time frame, resulting in 47 pages for further analyses.
- The 50 pages include 1,737 posts, 1,915 commenters and 3,371 comments. A total of 99 comments could not be captured due to privacy settings or deletion, resulting in the content of 3,272 comments.


