This report is based on responses from 353 journalism executives on the membership lists of the Radio Television Digital News Association (RTDNA) and the American Society of News Editors (ASNE). The survey was administered online in English by Princeton Survey Research Associates International (PSRAI). The surveys were completed from December 2, 2009 through January 30, 2010.
Requests for participation were sent via e-mail to all active newsroom executives on the membership lists – for a total of 1,298 individuals – with a link to a Web site where the survey was hosted by PSRAI. Each respondent had a unique identification code with which he or she could log in to the survey.
Definition of Population Universe and Contact Procedures
The universe of potential respondents was defined as journalists who are members of either the Radio Television Digital News Association (RTDNA) or the American Society of News Editors (ASNE). An individual news organization can and does have more than one RTDNA or ASNE member on staff. The invitations were sent to the individual members and not to the organizations. The two groups represent news organizations accounting for a majority of newspaper circulation and broadcast news audience in the U.S. All active executives on the lists were invited to participate.
RTDNA and ASNE members were first e-mailed on December 2, 2009, explaining the study and requesting their participation. E-mails included a link to the online survey as well as a unique password to gain entry into the web instrument. Follow-up e-mails were sent on December 10, 2009 and January 7, 2010 to those who did not already complete the survey or did not refuse to participate. Several weeks into the field period, RTDNA and ASNE staff also personally contacted non-responders from their respective membership lists as a final effort to encourage participation in the study.
Response Rates
A total of 353 members among the 1,298 potential respondents from the combined membership lists completed the survey, or 27 percent. Here is how the raw response rate varied by membership organization.

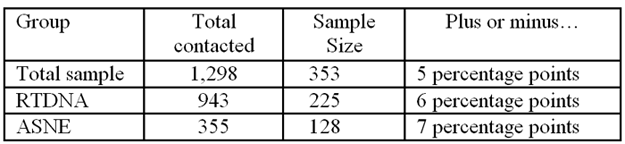
Margin of Error [1]
As a sample of the population of editors and executives of the two organizations, the survey is subject to sampling error. The following table shows the error attributable to sampling that would be expected at the 95% level of confidence for the total sample and the two groups separately:
Footnote:
1. This methodology statement was updated on May 18, 2010, after query from an outside publication led the Pew Research Center, Princeton Survey Research Associates International and the Project for Excellence in Journalism to review the sample in this survey and determine that it was more robust than originally described.


