Cognitive interviews
The cognitive interviews for the news consumption study were developed to assess
- how people engage with, consume and act on news and information;
- how news is consumed over vast and connected platforms; and
- the public’s understanding of emerging concepts at a time when familiarity with news sources and platforms may vary widely.
[14.numofset=”14″ Tourangeau, R. 1984. “Cognitive sciences and survey methods.”]
The survey is administered online; to mimic that setting, the cognitive interviews were conducted remotely with people using their personal devices. Each cognitive interview was conducted by one of three survey methodologists experienced in cognitive interviewing methods. Interviews were conducted using Zoom software between February 23, 2020, and March 9, 2020. The survey instrument was programmed using Voxco Acuity software. To minimize participant burden, the survey administration and cognitive interviews were designed to last no more than 60 minutes. Participants were asked to complete the online survey during the interview, allowing RTI staff to view their screen. If the participants agreed, the interviewers recorded the audio interaction and screen share using Zoom.
Interviewers typed notes into a protocol document during each interview. After each interview, the interviewers transferred their notes to a summary table, allowing for easier analysis of findings across interviews. As the interviewers transferred their notes, they reviewed the interviews’ video and audio recordings to ensure accuracy and to expand on any cognitive issues that were found. Due to technical difficulties in three cases, only audio data was captured. In most cases, the dialog that transpired between interviewer and participant was captured in the summary notes. In some cases, the interviewer paraphrased the dialog, especially if the discussion was lengthy.
Interviewers included in their notes any additional observations about issues that could help improve the quality of questions or response categories.
After the cognitive interviews, the cognitive testing team analyzed the notes and summarized key findings and recommendations across all interviews on a question-by-question basis.
Recruitment and Participants’ Profile
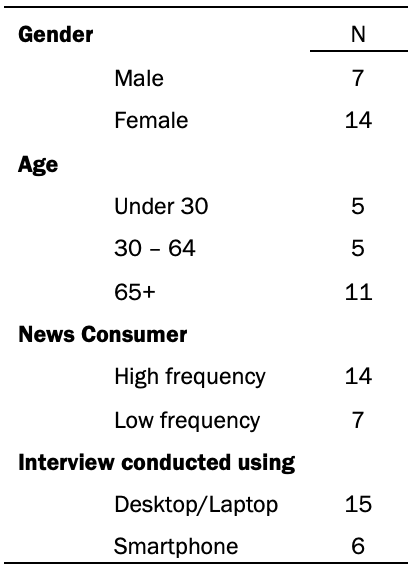
The cognitive interviewing recruitment protocol addressed variance in respondent age, gender, means of internet access (mobile versus PC) and news consumption level. The Center requested a total of 20 interviews with the following specifications: have five interviews with adults age 65 and over using a smartphone; five interviews with adults age 65 and over using a desktop or laptop; at least five interviews with adults under age 30; and at least five interviews with adults who consider themselves high-volume news consumers. RTI posted advertisements in the “volunteer” subset of the “community” section of Craigslist, an online community forum often used to recruit research participants, and in a NextDoor community located in Raleigh, NC. Craigslist advertisements were posted in various cities around the U.S. The advertisements described the requirements for participation and instructed interested persons to complete an online screening survey to determine eligibility. Individuals were then screened based on gender, age, the devices through which they receive news and their frequency of news consumption. A total of 28 recruits were selected for cognitive testing. Of those, 21 completed the cognitive testing, five refused before scheduling and two were no-show appointments. Each participant received a $50 Amazon e-card emailed to them as a token of appreciation for participation in the interview. The table below is a summary of the participants’ profiles.
Survey experiments
Survey experiments were conducted through Ipsos’ KnowledgePanel (KP) online Omnibus surveys to test different approaches to measuring and asking about news consumption. Two such surveys were carried out in mid-April 2020 with roughly 1,000 respondents per survey. The first survey, conducted between April 17-19, 2020 (N=1,031), experimented with the use of three measurement approaches: reference periods (i.e., no reference period vs. “typical week” vs. “past week”), relative and specific scales (i.e., “often, sometimes, rarely, never” vs. “number of days per week”) and item ordering. The second survey was conducted between April 24-25, 2020 (N=1,018) and tested two measurement approaches in particular: reverse relative response scales (often-never vs. never-often) and providing examples for provider items (or not).
Recruitment
Ipsos KP panelists are recruited using probability-based, addressed-based sampling (ABS). Samples are representative of U.S. adults aged 18 and older and include hard-to-reach population groups including noninternet households, for whom internet access and devices are provided in order to complete the online surveys.
A combination of random-digit dialing (RDD) and address-based sampling (ABS) methodologies have been used to recruit KP members. In 2009, KP switched its sampling methodology for recruiting panel members from RDD to ABS. Adults from sampled households are invited to join KP through a series of mailings, including an initial invitation letter, a reminder postcard and a subsequent follow-up letter.
For the two omnibus surveys, 2,856 and 2,857 panelists were sampled and invited to take part in each survey, respectively. All sampled members received an initial email to notify them of the survey as well as a link to the survey questionnaire. The completion rate was 36% in both surveys.
Weighting
For selection of general population samples from KnowledgePanel, a patented methodology has been developed that ensures all samples behave as equal probability of selection method (EPSEM) samples. Briefly, this methodology starts by weighting the pool of active members to the geodemographic benchmarks secured from the latest March supplement of the U.S. Census Bureau’s Current Population Survey (CPS) along several dimensions. Using the resulting weights as measures of size, a probability-proportional-to-size (PPS) procedure is used to select study-specific samples. It is the application of this PPS methodology with the imposed size measures that produces fully self-weighing samples from KnowledgePanel, for which each sample member can carry a design weight of unity. Moreover, in instances where a study design requires any form of oversampling of certain subgroups, such departures from an EPSEM design are accounted for by adjusting the design weights in reference to the CPS benchmarks for the population of interest. Sampling errors and test of statistical significance take into account the effect of weighting.
Once all survey data have been collected and processed, design weights are adjusted to account for any differential nonresponse that may have occurred. Depending on the specific target population for a given study, geodemographic distributions for the corresponding population are obtained from the CPS, the U.S. Census Bureau’s American Community Survey (ACS) or in certain instances from the weighted KnowledgePanel profile data. For this purpose, an iterative proportional fitting (raking) procedure is used to produce the final weights. In the final step, calculated weights are examined to identify and, if necessary, trim outliers at the extreme upper and lower tails of the weight distribution. The resulting weights are then scaled to aggregate to the total sample size of all eligible respondents.
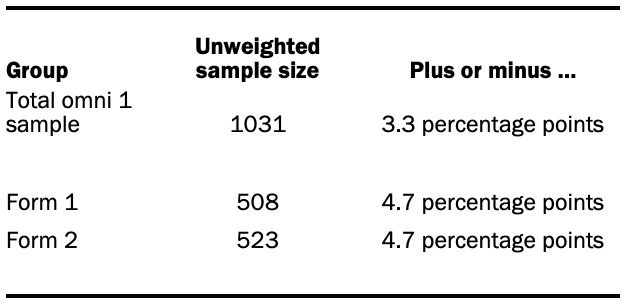
The following table shows the unweighted sample sizes and the error attributable to sampling that would be expected at the 95% level of confidence for different groups in the first (April 17-19) omni sample:
The following table shows the unweighted sample sizes and the error attributable to sampling that would be expected at the 95% level of confidence for different groups in the second (April 24-25) omni sample:

In addition to sampling error, one should bear in mind that question wording and practical difficulties in conducting surveys can introduce error or bias into the findings of opinion polls.
The News Consumption survey
The analysis in chapter one of this report is primarily based on a nationally representative online survey conducted for the Pew Research Center on Ipsos’ KnowledgePanel (KP), a probability-based web panel designed to be representative of adults in the U.S. The survey was carried out from June 2 to June 11, 2020, in both English and Spanish among a sample of 3,715 noninstitutionalized U.S. adults ages 18 years or older. Of these, 2,021 respondents constituted a general population sample and were weighted to be representative of the U.S. adult population.
An additional 1,694 respondents who agreed to have their digital activity monitored also took the same survey, with some additional questions designed to capture their self-reported digital news use. This set of respondents is referred to as the “passive” sample, as they agreed to have their digital activity measured passively. The passive sample was drawn from Ipsos’ existing pool of KP members and only includes those who had internet access at the time of their recruitment. All recruited passive panelists gave their consent to have their devices tracked and linked to their survey data.
A combination of random-digit dialing (RDD) and address-based sampling (ABS) methodologies have been used to recruit panel members for KP. In 2009, Ipsos switched the KP sampling methodology for recruiting panel members from RDD to ABS.
In all, 5,351 panelists were sampled and invited to take part in the survey. All sampled members received an initial email to notify them of the survey as well as a link to the survey questionnaire. Additional follow-up reminders were sent as needed to those who had not yet responded. The study completion rate was 69.4%. The cumulative response rate is 5.1%. The break-off rate among panelists who logged onto the survey and completed at least one item is 3.1%.
The data were weighted in a multistep process that begins with a base weight and incorporates the respondents’ selection probability. The surveys were raked on gender x age, race and ethnicity, education, Census region, household income and English and Spanish language proficiency. Benchmark estimates for all but language proficiency came from the March 2019 Current Population Survey (CPS) Supplement, and language proficiency estimates were based on the 2018 American Community Survey (ACS). Final weights were calculated separately for the passive and nonpassive samples in this study.
Sampling errors and test of statistical significance take into account the effect of weighting.
In addition to sampling error, question wording and practical difficulties in conducting surveys can introduce error or bias into the findings of opinion polls.
The following table shows the unweighted sample sizes and the error attributable to sampling that would be expected at the 95% level of confidence for different groups in the nonpassive and passive samples:
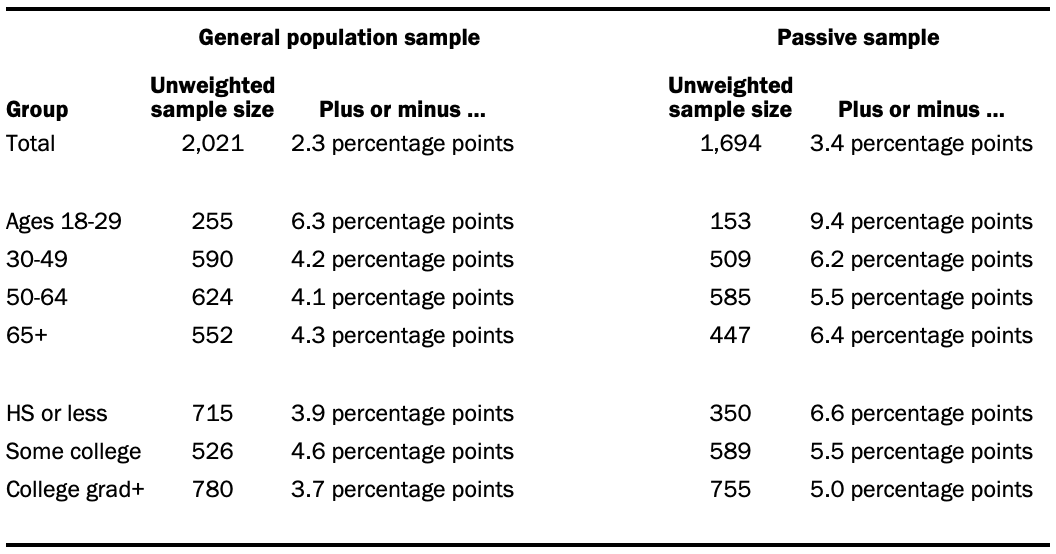
Sample sizes and sampling errors for other subgroups are available upon request.
Passive data
Recruitment and data collection
Ipsos KnowledgePanel members were recruited to participate in passive monitoring of their online activity. Those who agreed were given a privacy statement and consent form detailing what data would be collected and what would be done with the data. They then installed a tracker from Reality Mine on their mobile device (including tablets) or PC. On PC, data was tracked using a browser plug-in and a software package; on mobile, it was a VPN and, in the case of Android devices, a mobile app. Recruitment was continuous, as panelists could drop out at any time, so panel composition varied over time. While this tracking was done from April through July, 2020, the report uses the passive data collected between May 16 and June 15, 2020 (though in many cases limits analysis to the week before the respondent’s interview date).
In total, 1,694 members of KP consented to the passive monitoring and completed the News Consumption Survey. However, not all who consented provided usable data. An individual’s passive data was considered valid if there was data recorded for any of the seven days prior to their survey completion (the survey questions asked about the number of days in the past seven days that they had done various activities). Ultimately, both valid passive data and survey response were obtained from 1,416 KP members.
About one-in-five (19%) panelists were tracked on more than one device. Half (50%) were tracked on at least one PC, and 63% were tracked on at least one mobile device. The data was provided at the level of the user and day, such that each line would aggregate all instances of a panelist performing a given event on a given day. Events could be the panelist visiting a website, using an app or watching a video. Web browsing data was aggregated at the domain level. Individual links were not analyzed. The number of distinct events and the total duration were recorded. Website visits were only recorded if they occurred within a browser. This means that, for example, tapping a link to pewresearch.org in a social media app would not be recorded. Any event where the average duration (total duration of the event type on that day/number of events of that type on that day) was less than five seconds was excluded, matching a cutoff we have used in previous research. This cutoff is used because events less than five seconds in duration were most likely refreshes or people clicking on a link erroneously and then closing it.
Matching events to behaviors asked in survey
Each event was classified as a match or a mismatch for each of the survey questions used for the comparison between the self-report and passive data. This included both the broad question of whether an event was a visit to a news website or app as well as more narrow questions of whether it was a visit to a specific social media platform or website domain.
News websites and apps
To match a passively tracked event to an answer to the question “In THE PAST 7 DAYS, how many days did you get news from a news website or app?” researchers created a whitelist of news websites from a variety of databases (modeled in part after what the Center does for the State of the News Media fact sheets).
- National news websites: Researchers hand-coded each website in Comscore with at least 4 million monthly unique visitors in the fourth quarter of 2019, looking for evidence of publishing current events content on their homepage (as of February 2019).
- Local news websites: any site listed on Michele’s List.
- Local TV: any news-producing ABC, CBS, Fox or NBC network affiliate in the top 100 markets listed in the BIA database.
- Commercial radio: any news-producing station (i.e., their format is classified as news, news/talk or news/talk/info) in the top 100 markets listed in the BIA database.
- Public radio: the top 129 public broadcasting stations, as aggregated and provided by Mark Fuerst, director of consultancy, Public Media Futures Forum, using the Annual Financial Reports submitted by each licensee to the Corporation for Public Broadcasting (CPB).
- Newspapers: any daily newspaper in Editor & Publisher’s database in the top 100 markets.
This resulted in a list of 2,416 news organizations (without de-duplicating) with their primary domain. For each, researchers searched the Google Play store for their primary app, if one existed, and the name and unique ID were recorded. For the Apple App Store, the API was queried using the news organization name, and the app ID and name were returned. The results were hand-verified; in some cases, the API was re-queried with a slightly different name in order to obtain more accurate results. This resulted in a further list of 1,272 Android apps and 947 iOS apps.
Other events (social media and news organizations)
For questions about specific news organizations and social media (e.g., “In THE PAST 7 DAYS, did you get news from the WEBSITE OR APP of any of these news organizations? That is, did you get news ONLINE from any of these? … USA Today”), a list consisting of the primary domain, the primary Android app and the primary iOS app was constructed for each item. Websites and Android apps were found through search, while the iOS app was found by querying the API.
Calculating summary variables
For each panelist, summary variables were calculated for each event type. This measured the number of days, in the seven days before their survey interview, that their passive data showed evidence of each event. For instance, if a panelist was interviewed on June 4, visited foxnews.com on June 2 and used the Fox News iOS app on May 30, the summary variable for Fox News would show two days.
Note that some survey questions were not matched to passive data. In the case of the question about getting news from YouTube, researchers did not have the resources to code the tens of thousands of videos in the dataset for news vs. non-news content (however, see our recent analysis of news on YouTube). In the case of news aggregators, our results showed that many respondents do not use the four aggregators asked about for getting news. Additionally, for Google News, the passive data as structured would not allow for accurate identification of visits to Google News since its primary domain, news.google.com, is a subdomain of google.com. And one of the news organizations was omitted from analysis, i.e., ABC News, which has a primary domain of abcnews.com but which often links on its Facebook page to abcnews.go.com. Since the go.com domain incorporates a large amount of non-news content (e.g., Disney), this question was omitted from analysis.
Comparing survey responses to passive data
Survey responses were compared to passive data in two ways. The first was at the aggregate level. This analysis compares the weighted percentage of passive respondents who say they got news from a specific online source (e.g., the BBC) in the past seven days and compares this to the weighted percent of panelists with valid passive data who visited that source online in the seven days before their survey interview date. In nearly all cases, the survey responses showed higher incidence than the passive data.
Other comparisons were at the individual level. Each panelist’s survey responses were compared to their passive data, and if their survey responses indicated greater usage than their passive data, they were deemed to have a mismatch. In the case of the general news websites and app question and the social media questions, this meant that they said in the survey that they did the activity on more days than could be found in their passive data. In the case of the news organization questions, a mismatch occurred only when respondents said in the survey that they had visited the organization online in the past week, but the passive data did not show any instances of this.
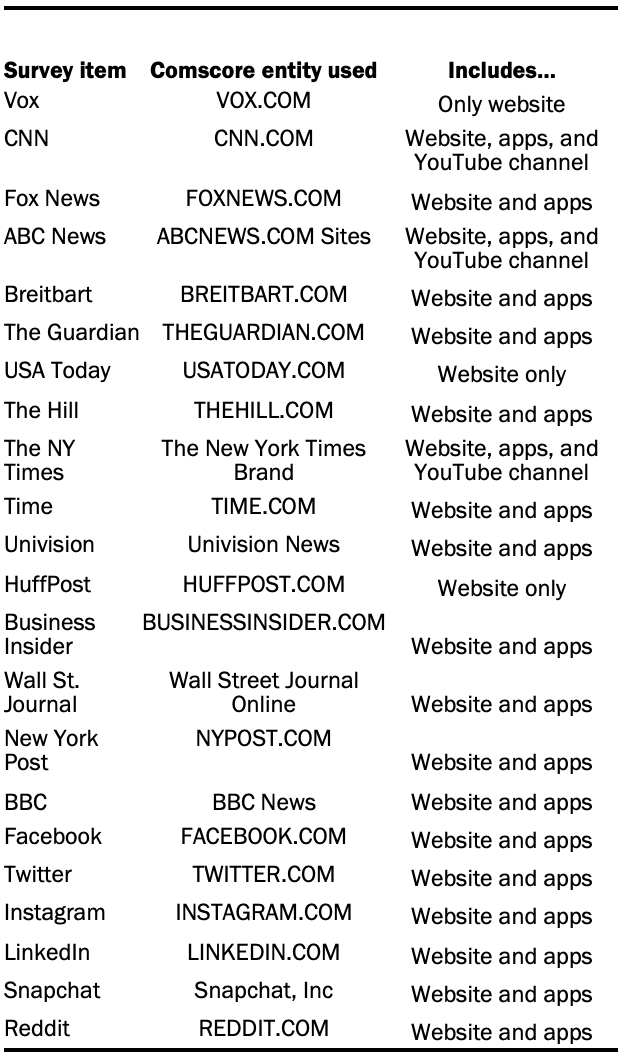
Comparison to traffic data
In the final chapter of the report, results from the survey and passive data are compared with traffic data. This data comes from Comscore, a cross-platform measurement company. Entities were chosen for each news organization and social media service. In each case, the entity whose dictionary definitions were the closest match to the way the data are analyzed above, where a visit to The New York Times online could be to their primary domain (nytimes.com), their iOS app or their Android app was chosen. In some cases, to get an entity that included both website and apps, it would also include the organization’s YouTube channel. In the case of organizations that are not exclusively news-producing (e.g., the BBC and Univision), efforts were made to choose a news-specific entity. Details are below. Data come from the Comscore Media Metrix® Multi-Platform U.S. database for Total Digital Population, May 2020.