This analysis is exploratory research aimed at gaining a deeper understanding of news habits on Twitter by using a survey-based sample to identify a representative group of Twitter users and study their behavior. The study is based on Twitter activity of 176 U.S. adults who identified themselves as Twitter users and gave Pew Research Center permission to collect and analyze their Twitter activity.
This study was conducted by Pew Research Center in association with the John S. and James L. Knight Foundation.
The Group Studied
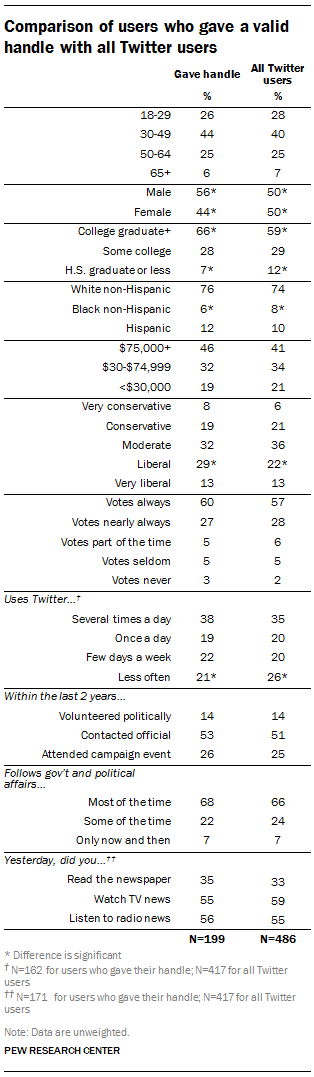
These 176 users were drawn from a representative survey of 3,212 U.S. adults in the American Trends Panel (recruited initially from a 10,013-person phone survey).1 Of the 486 Twitter users in the survey, 218 (45%) provided their Twitter handles for analysis. Of these, 19 were invalid and 23 were private, leaving 176 publicly accessible accounts for analysis.
To evaluate whether there is any bias among those who allowed researchers to collect their Twitter activity compared with those who did not, researchers ran statistical comparisons between the group who gave their handles and all Twitter users in the survey to see if they differed in any significant ways. For the majority of qualities measured – age, income, voting behavior, political activism, interest in news and usage of other news media such as newspapers and television – we found no bias among those who provided their handles compared with those who did not. There are five exceptions, though the differences are relatively small: Handle providers are somewhat more likely to be male, to be better educated, and to be ideologically liberal, and less likely to be black or to report using Twitter fewer than a few days a week. Therefore, while the total numbers are small, the group is a representative sample of Twitter users.
This takes a different approach than that of many other Twitter studies, which are based on massive data sets collected through non-random sampling. These non-random analyses tend to assign characteristics to users based on activity – analyzing, for example, accounts followed to estimate users’ political ideology, or using the content of their tweets to predict their gender. The technique used here pairs actual user demographics with established methods of analyses including human coding to create a rich picture at the individual user level. Still, we present these findings in the frame of exploratory research.
The Analysis
Using six months of data pulled from the Gnip Firehose and Twitter API, researchers examined the tweets users sent over four randomly selected weeks (August 10-16, 2014; December 14-20, 2014; January 25-31, 2015; February 1-7, 2015) – a total of 6,538 individual tweets. Through hand coding, researchers analyzed various characteristics of those tweets: if they were about current news, if the tweeter added their opinion to the tweets about news, and what the topics of the tweets about news were. We also examined the tweets they sent for some variables that are detectable without hand-coding: how many times they tweeted, as well as if a tweet had a URL, a hashtag and/or a photo, and if it was a retweet, a reply, or an “original post” (not a retweet or reply).
When reporting these analyses, we average the makeup of each user’s activity instead of reporting a percentage of the corpus of tweets. This means that, for example, when looking at retweets vs. replies vs. original tweets, we report that on average, 16% of a user’s tweets are replies, as opposed to saying that a percentage of all tweets are replies. We do this to keep the data from being skewed by a small number of highly active users, as the makeup of many behaviors on Twitter include a large number of moderately active users offset by a hyper-active minority.
To analyze the degree to which the tweets users send are related to news, and what topics these news tweets address, researchers took several steps. First was to define news in the same manner as in recent Pew Research Center surveys: information about events and issues beyond just your friends and family. This is a broad definition aimed first at separating that which relates solely to friends and family from that which relates to broader information gathering. Then, within the content that is news and information, tweets were categorized into news topics to speak to the range of subject areas. This allows us to see what portion of the activity is around entertainment vs. sports vs. government and politics, among other topics. Within each of these topics, there is a wide range of the type of news and information being shared – from things like who won the Super Bowl to a player publicly announcing his use of steroids, or from details of a presidential debate to a link to a long piece on a candidate’s views on various issues.
Finally, we hand-coded a random sample of the accounts these users follow to see what type of users made up their feed. This allowed us to see to what extent users follow news media organizations, journalists and commentators; other types of widely known individuals and organizations (whether in the realm of entertainment, sports, business or technology); and individuals who are not public figures (and, therefore, most likely the user’s friends and acquaintances). After classifying the accounts by type, we took the analysis one step further and determined how many tweets each type of account. This allowed us to see not only the most commonly followed types of accounts, but the types of accounts whose tweets were most likely to be seen by users.